Comfort Levels, again?!

Yeah, this lesson cannot be skipped.

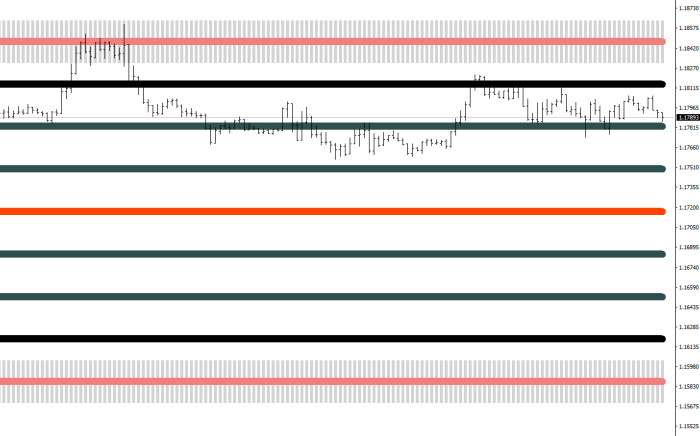
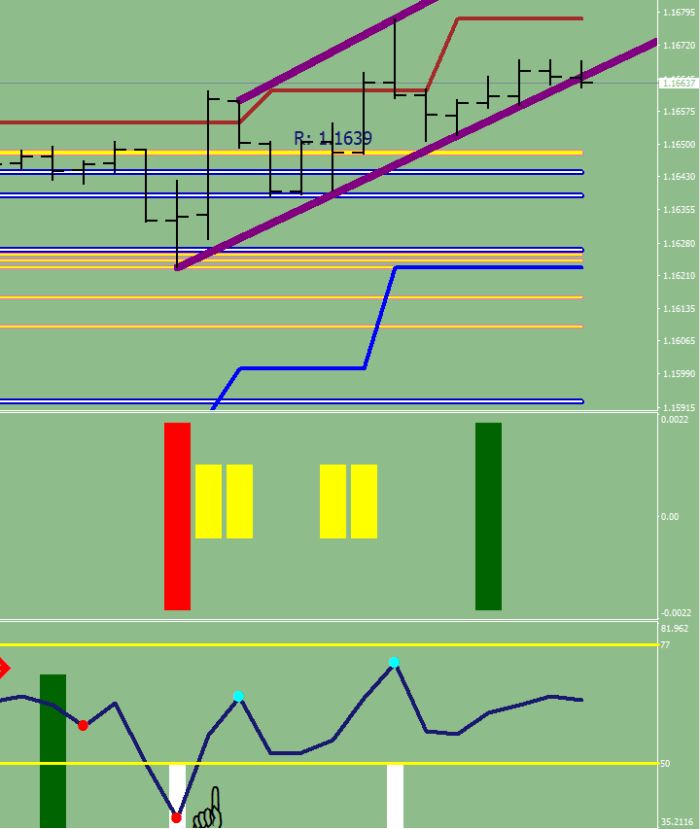
When I first came up with my own, horizontal stochastic plots, I had of course the maximum sample available by MT4 as limitation – which varies per time frame i.e. 1025 on 1H and 1590 on 4H -, and the idea that before a break out would occur, price would pass by the 5% mark from below, similarly, if the new lows/highs are finished, price would have to retreat beyond the 5% mark, so for these reasons I started plotting lines at 5, 15, 25 etc. percents of the total range.

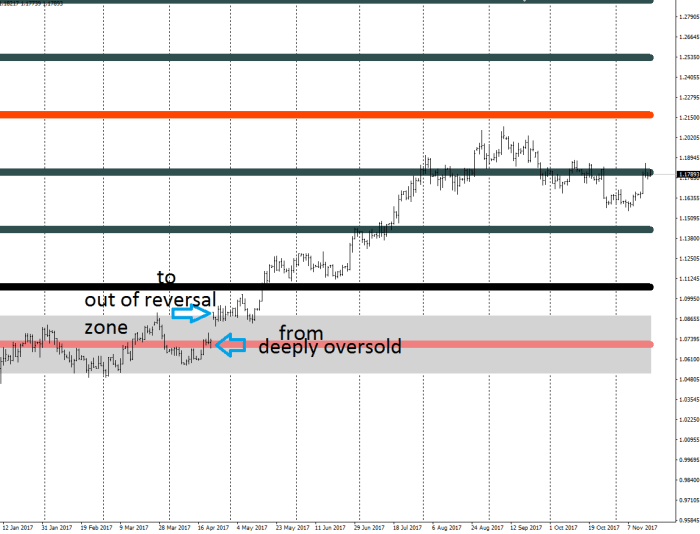
Of course, this did not have the 50% mark, but gave me a few insights, such as: the reversal would most likely take place in the 5-15% zone, which I started calling the reversal zone conclusively. Back then the 5% line was a red line, and I even made a Red Line Reversal EA based on the idea. Your stop loss can be put just beyond the 5%.

These days the comfort levels are at the round 10s, so the pivot, the deeply overbought/oversold levels as well as the overbought/oversold necklines are in the right place, but the issue of the 5-15% not being plotted has been bothering me.

A shaded field would use much of the computer resources, although with the current i7/16GB I’m typing on this is not an issue any more. For other computers though it is a good idea to make the shading with the use of histogram lines instead of objects.

EUR395

…with further zoom, the gray fields become rows of stripes giving some opacity effect.

EUR396

I will upload this version of the Comfort Levels later on, but I need to find the header for the routine, and currently I do not even know which laptop has it, the Dell or the Toshiba.

The big question is which time frames should you use this on?

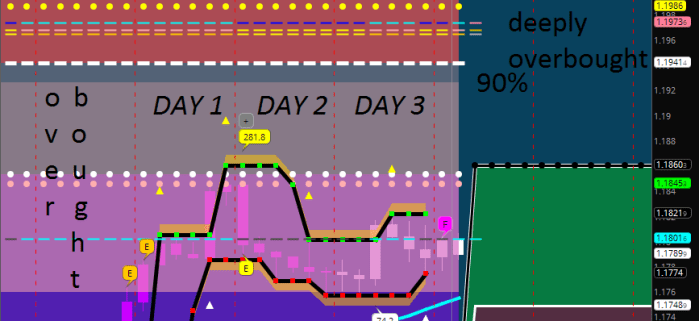
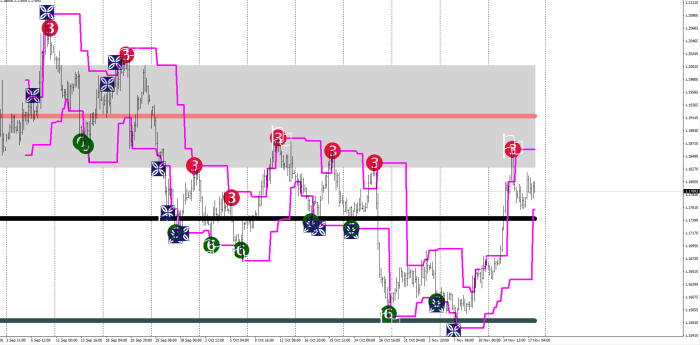
4H is very important, for you just had 3 days spent in the overbought field, which made price embedded (I have written enough about this condition, but Ira Epstein is the originator of this expression), which means, that any dip would be a buy to the neckline and perhaps even beyond, for they can go outside for a day and save it on the next one.


EUR397

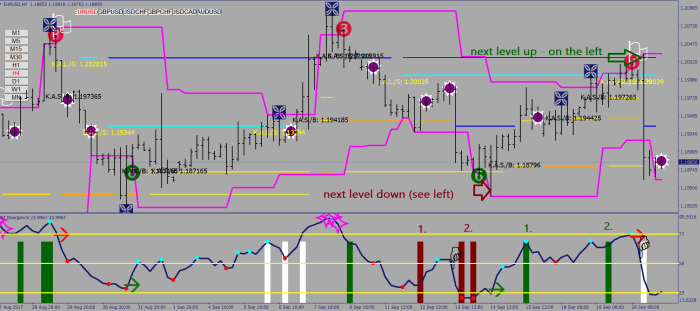
To me it is not a question any more that the target currently is at 1.1986

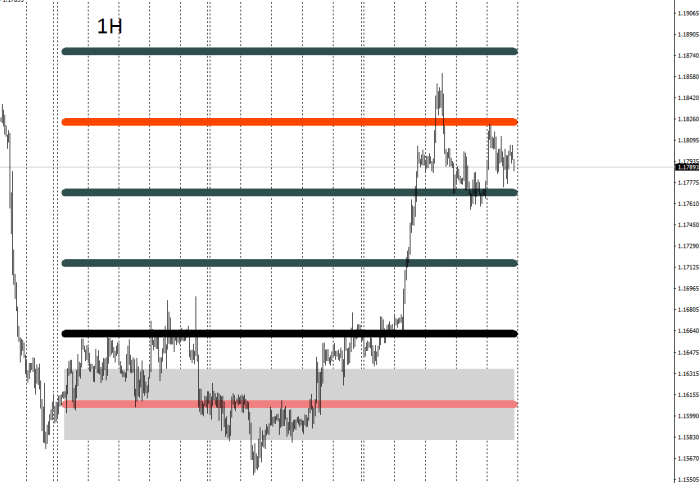
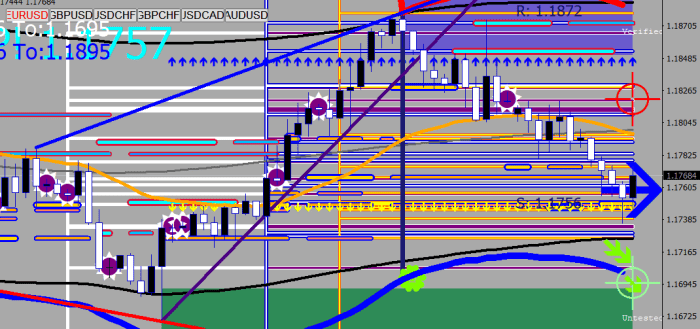
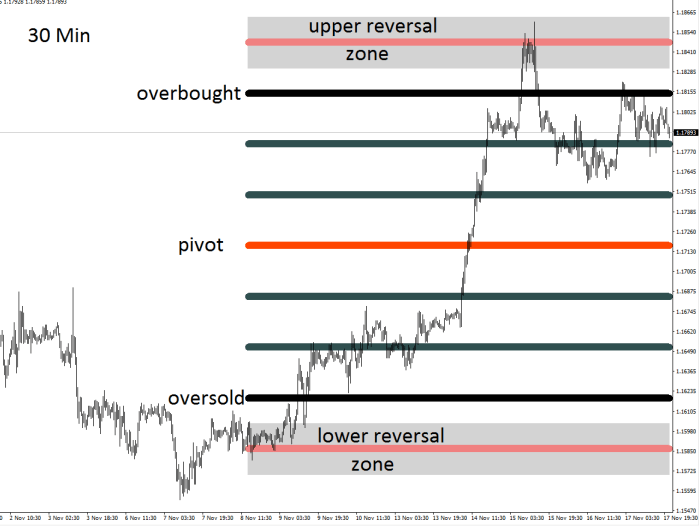
The 1H puts the upper reversal zone between 1.2011 and 1.2065 and currently has a failed break above the pivot, consolidating just below it.

EUR398

The 30 minute, as you can see on Fig 1, encompasses the whole move, and the imaginary red line / start pistol is at 1.1863-ish, from where you would be hitting the 5% mark on your way to expanding the range.

Now, FYI the latest threat is that the Dollar would be declining for the next 5-6 years straight, for there is a completely new world starting to shape up where the USD is no longer the world’s reserve currency, and on every bad news people may end up fleeing into other currencies, especially the Euro, for they see the steady growth and know that the ECB would be running out of excuses for keeping the stimulus on pretty soon.

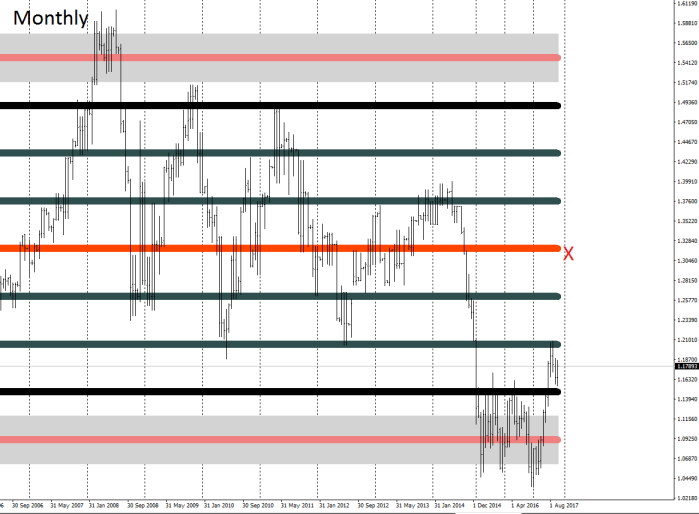
So, where would you be expecting the Euro to come back up to? For starters, to the monthly pivot.

EUR399

As a bonus image here’s the gap up (on the daily) that made all the rally happen:

EUR400

Bonus image 2

36 V1.3.2 on 4H, where it was intended for

EUR401

36 EA

I have a lot to write about, so here is something else in the meantime.

36 was never meant to be merely an indicator.

The path to turning it into an EA came naturally.

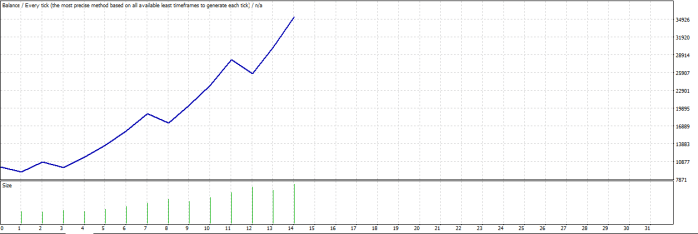
The sizing is equity dependent, and currently would figure 1 micro lot per $100.

There are things to play with from size (here called Leverage), stop loss, target, magic numbers, close in pending seconds, EA choke flag and the RSI values (4H, 8 sample HL2).
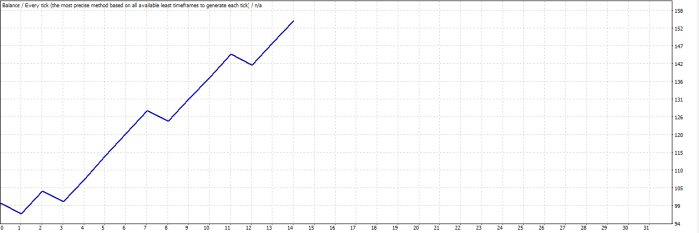
36_EA_V1_1_4H

– Try this only on EUR/USD if your spread is low, variable, not fixed (mine is 0.2 pips on average, the test image was done with 0.4 pips),

– peg it onto either a 4H or a 30M chart – and turn auto trading on.

36_EA_V1_1_4H_report

I shall make this available for a limited time only.

Apologies: I forgot that the Leverage was not external in the previous posted version, so the visitors 100 count starts now, the first 31 does not matter.

Visitors2

…expired…

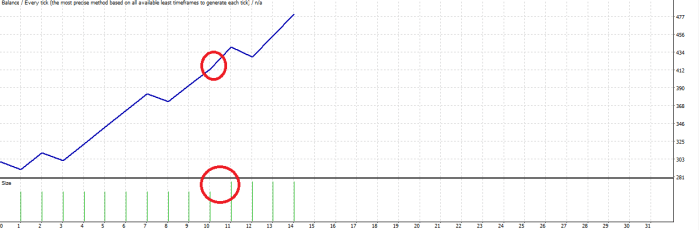
Picture below: size adjusts with every $100 equity gained
36_EA_V1_1_4H_2

With larger equity the profit factor can be higher.

36_EA_V1_1_4H_3

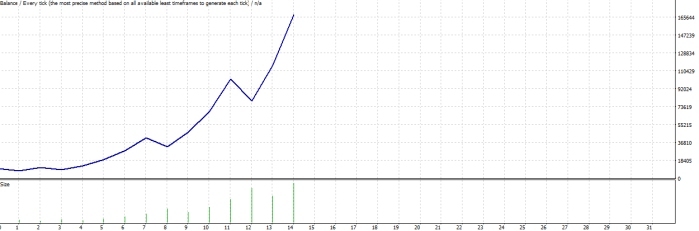
And gains can become exponential when multiplying the size. 3x example below:

36_EA_V1_1_4H_4_report

36_EA_V1_1_4H_4

8x the charm…

36_EA_V1_1_4H_5

36_EA_V1_1_4H_5_report

I was meant to put this up for sale on the MT4 market, but when totally failing to communicate / get a pass by the monkeys running the show during my efforts with the Market Maker Lines, I had to surrender.

———————————————————————————————————————————————–

Support Team 2017.10.05 08:07 #1  EN

Improve your Product description

Your product description is not comprehensive enough, please try to better describe the idea of your product.

If your product has inputs, add them as a list of parameters with descriptions.

For this purpose, the editor provides the Bulleted list and Numbered list commands. If you want to create subparagraphs inside the list, use the Increase indent command.

Example:

Indicator parameters

  • period – the number of bars used for the indicator calculations. Proper values – from 5 to 50.
  • High_TF – the higher timeframe, from which the indicator values are taken. Must not be smaller than the timeframe of the chart the indicator is running on.
    • M1
    • M30
    • D1
  • ShowEntries – show entry points in history on the chart for visual analysis.

Use the editor functions, do not copy/paste from other programs.

 

Redesign your Logo

To learn how to prepare an attractive logo, please read the following article: Tips for an Effective Product Presentation on the Market

As far as the graphics format is concerned, the best thing to do is to use PNG format because it allows to keep the quality high both at editing and transferring files. We strongly recommend you to refrain from using JPG.

A good logo should be simple and describe the basic idea of the product. Fine details are also inadvisable because they are usually difficult to make out. A picture overloaded with too many colors and graphic effects will not serve as a good logo either. Ideally, 3-4 colors and a couple of recognizable images are enough to design a logo. Trade terms, wildly used and familiar to every trader, could be used in the inscription. They will play a significant role in conveying the idea of the product. For example, Buy, Sell etc. Serif fonts are better be avoided. Keep it simple so everyone can read the logo.


Promotion of third-party resources in Product descriptions is not allowed.

The Product page cannot be used for promotional purposes. You are not allowed to publish links to external resources in the product description, its logo, video or screenshots. The full Product description must be given directly in the Market.


Fix errors in the program code

Programs should not contain critical errors that lead to immediate termination:

  • division by zero
  • going beyond array boundary
  • using an incorrect object pointer

Start your program on a chart and try to change it timeframe or symbol. Restart the terminal with an indicator/Expert Advisor attached to it. Such actions should not lead to program errors.

Not enough history data or vice versa too many bars on the chart should not hinder the client terminal operation or cause excessive use of computer resources.

2017.10.05 11:06:05.905    Market_Maker_Lines_DC XAUUSDcheck,Daily: array out of range in ‘_Market_Maker_Lines_DC.mq4’ (1060,17)

108

Me 2017.10.06 15:42 #2  EN

New version validation passed.

After submission: under one minute rejected. What does this mean? What to do here?

Support Team 2017.10.09 08:41 #3  EN

Timur Yakupov:

Improve your Product description

Your product description is not comprehensive enough, please try to better describe the idea of your product.

If your product has inputs, add them as a list of parameters with descriptions.

For this purpose, the editor provides the Bulleted list and Numbered list commands. If you want to create subparagraphs inside the list, use the Increase indent command.

Example:

Use the editor functions, do not copy/paste from other programs.


Redesign your Logo

To learn how to prepare an attractive logo, please read the following article: Tips for an Effective Product Presentation on the Market

As far as the graphics format is concerned, the best thing to do is to use PNG format because it allows to keep the quality high both at editing and transferring files. We strongly recommend you to refrain from using JPG.

A good logo should be simple and describe the basic idea of the product. Fine details are also inadvisable because they are usually difficult to make out. A picture overloaded with too many colors and graphic effects will not serve as a good logo either. Ideally, 3-4 colors and a couple of recognizable images are enough to design a logo. Trade terms, wildly used and familiar to every trader, could be used in the inscription. They will play a significant role in conveying the idea of the product. For example, Buy, Sell etc. Serif fonts are better be avoided. Keep it simple so everyone can read the logo.


Promotion of third-party resources in Product descriptions is not allowed.

The Product page cannot be used for promotional purposes. You are not allowed to publish links to external resources in the product description, its logo, video or screenshots. The full Product description must be given directly in the Market.


Fix errors in the program code

Programs should not contain critical errors that lead to immediate termination:

  • division by zero
  • going beyond array boundary
  • using an incorrect object pointer

Start your program on a chart and try to change it timeframe or symbol. Restart the terminal with an indicator/Expert Advisor attached to it. Such actions should not lead to program errors.

Not enough history data or vice versa too many bars on the chart should not hinder the client terminal operation or cause excessive use of computer resources.

2017.10.05 11:06:05.905    Market_Maker_Lines_DC XAUUSDcheck,Daily: array out of range in ‘_Market_Maker_Lines_DC.mq4’ (1060,17)

108

Me 2017.10.09 22:21 #4  EN

Support Team:

I don’t understand what is going on. I posted a different version and I got the same message copied and pasted with the including the error message from the 5th of November that was cured already.


I do not know what to make of your impersonal messages.

There is nothing wrong with the description and what is this thing about the logo coped here all the time?


Could I get something other than this blabla?

Thank you in advance.

108

Me 2017.10.15 04:39 #5  EN

Not sure what is happening yet again.

I show a rejection, and I am unable to delete the last uploaded version, and

I do not have an upload product file icon either.

Support Team 2017.10.16 15:02 #6  EN

Hello, if you have any problem with this, use servicedesk please.

Support Team 2017.10.19 10:02 #7  EN

Improve your Product description

Your product description is not comprehensive enough, please try to better describe the idea of your product.

If your product has inputs, add them as a list of parameters with descriptions.

For this purpose, the editor provides the Bulleted list and Numbered list commands. If you want to create subparagraphs inside the list, use the Increase indent command.

Example:

Indicator parameters

  • period – the number of bars used for the indicator calculations. Proper values – from 5 to 50.
  • High_TF – the higher timeframe, from which the indicator values are taken. Must not be smaller than the timeframe of the chart the indicator is running on.
    • M1
    • M30
    • D1
  • ShowEntries – show entry points in history on the chart for visual analysis.

Use the editor functions, do not copy/paste from other programs.
Wa hepü?


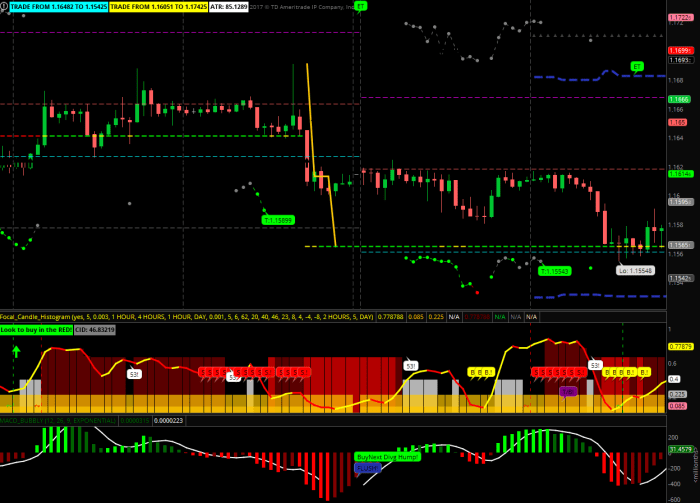
There was an implusive move down, shown by Projected Dist ufo routine (yellow zigzag) on TOS. No Fibonacci, merely a 1.5x multiplication.

EUR370

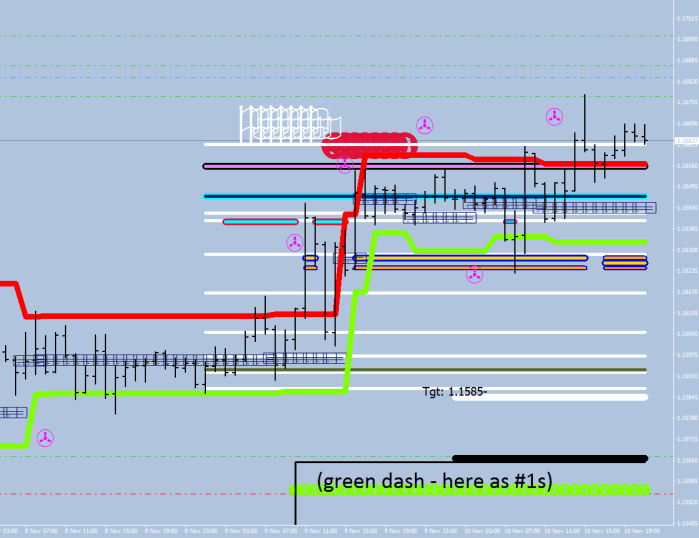
I also have the Projected Distance Lines in MT4, that plots that green dash, although the lightning is not plotted.

EUR371

Now, how would you have known that you were looking for a turn and do not have that MACD Bubbly plot above on the black screen with the FLUSH / Buy Next Divergent hump?

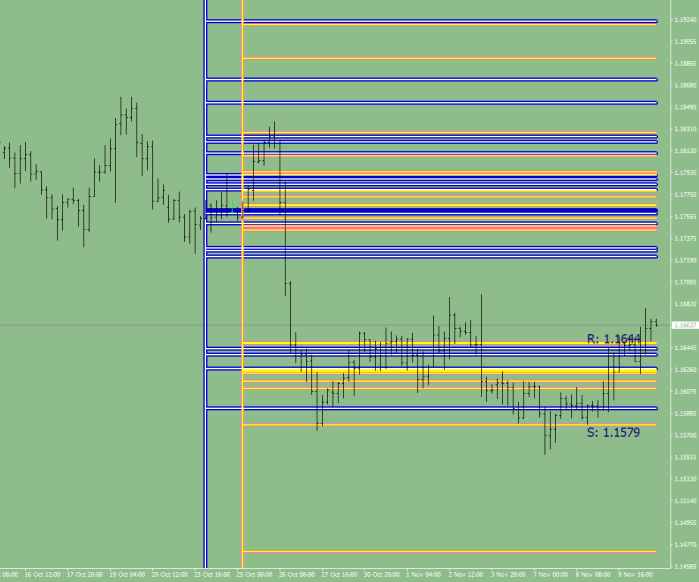
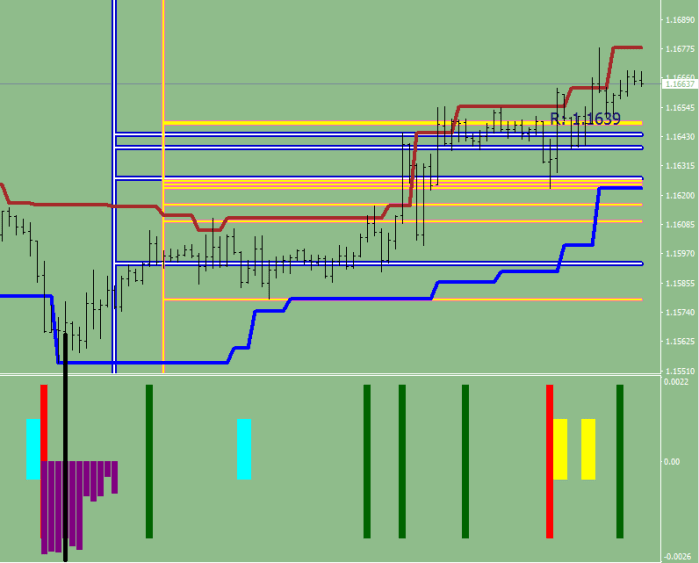
You could have noticed on the Market Maker lines plots, that 1.1579 is a significant Market Maker support level, for the next yellow support line is not until 1.1470.

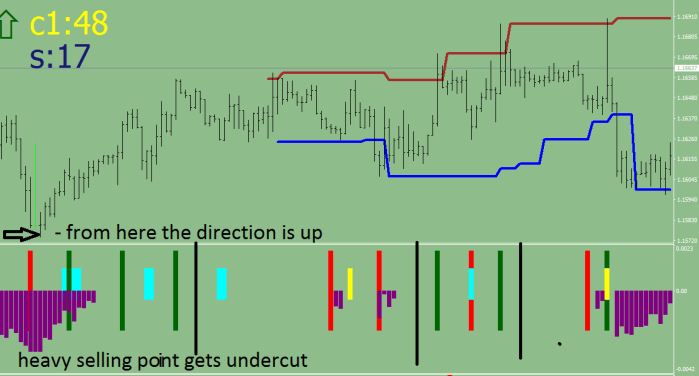
EUR372

(By the way, the 1.1580 level was not printed by the recent low, it was printed by a lift that the Market Makers gave on the way up towards 1.21 by volunteering to hold some shorts in the meantime.)

Now, here comes the essence of this article.

The Rhythm of the market

To warm up, here’s some practice.

Every move has an exhaustion in the given direction at the beginning of the move and another one at the end, which normally would get exceeded for a total reversal.

a) the reversal point beyond the terminal exhaustion

EUR373

b) this correction had the undercut within the same hour, so that became the new low – a correction like this helps sustaining the move up

EUR374

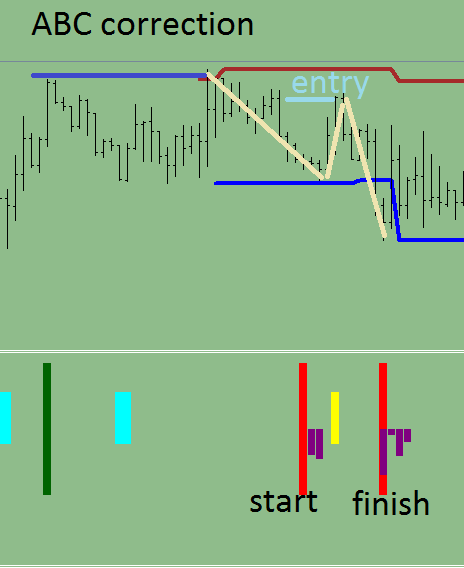
c) there was one more move up, with low energy and this ultimately prompted a reversal back down – the red in the middle is a smaller liquidity break, quite possibly an ABC, but on a less than 1H time frame

EUR375

Now for the selling part…

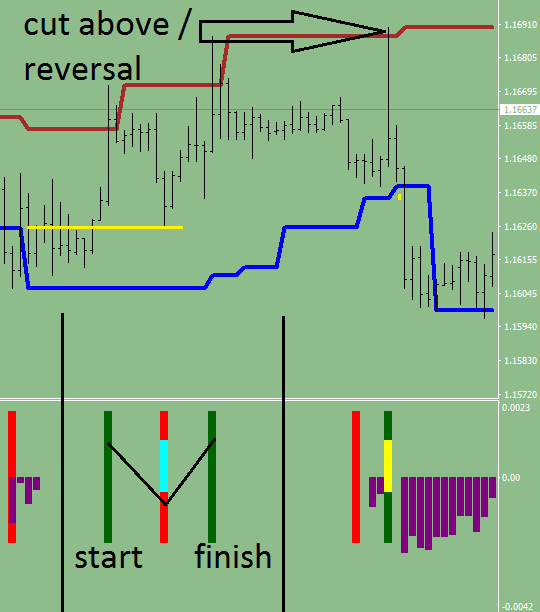
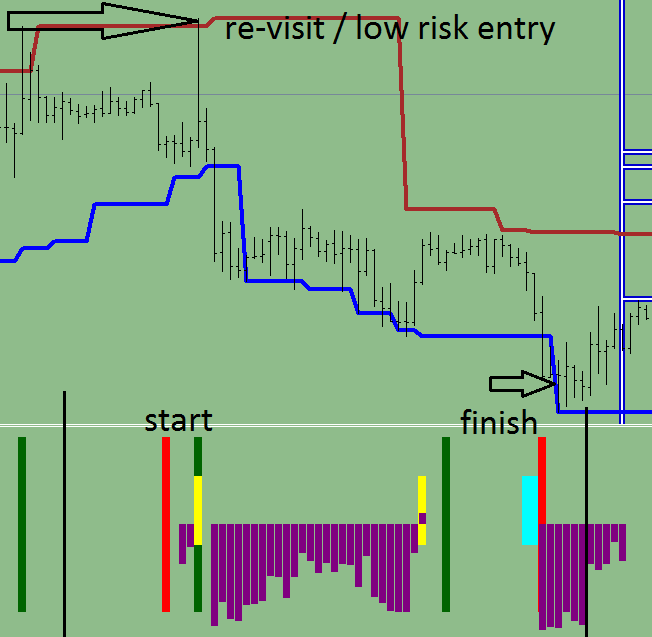
The reversal of course took place upon the cut above the last buying exhaustion, you on the other hand, first had a new tact starting with a longer pause, now with a selling exhaustion, and there was a generous 4 hours for a low risk entry to be on board for the next leg. The undercut was 10+ pips below the downside exhaustion and 23 pips under the MM support level. Factor in max 30 pips for a stop.

EUR376

There is a problem with the current up move: it is not impulsive in terms of printing an upside extension target. 1.1690 would surely be tough to conquer. When the lines are too close to each other, ignore the second (echo or double).  I believe we had the 3 legs up already.

EUR377

There is sort of a channel, but the Friday close was printed outside.

EUR378

The hand below would suggest a low risk buy at 1.1620-1.1610

The same time, the close is between the hard and a rock place:

EUR380

The thick black line is the oversold neckline, the coral line lower is the deeply oversold one. The biggest moves happen when price breaks below the overbought neckline or breaks above the oversold neckline, for then you have a prospect of hitting the other neckline or at least travel half way.


For some additional knowledge, here’s this (example of uptrend):

  1. black oval – break above the weight + 12 pips (red cordon)
  2. green oval – low risk entry: latest support printed

EUR379

(the orange ones are MM support levels)

_Weight-Reversal

My last piece of bearish evidence as follows (USD chart) – please don’t freak out, I took away half of the plots as it is…

DXY

The green fields are the different time frame Lema triplets and their force fields. It seems like an impenetrable mega sized gooey flubber-mess.
 

As for the technical part.

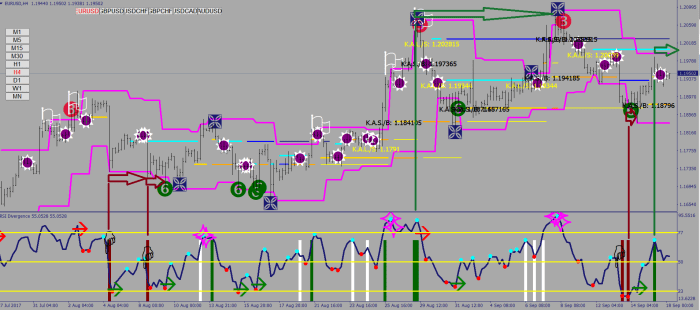
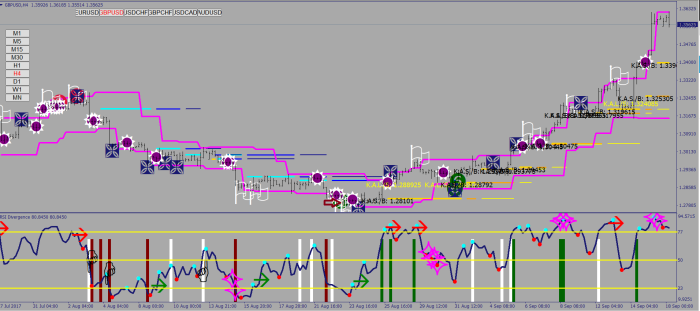
The two levels I monitor crossing below for in this ancient version is 44 and 25.

(ChoppinessIndex(7,i+1)>44 && ChoppinessIndex(7,i)25 && ChoppinessIndex(7,i)<25)

7 sample on 1H = 14 sample on 30 Min

And for the color of the indicator I compare the current close with the one 5 hours earlier.


The target in mind was clearly 1.1690 as the 4H shows.

EUR383

EUR381

Don’t worry about the wedge lines not being outside, they are RSI lines, and they are correct.

EUR382


Test Drive This Logic…

EUR344

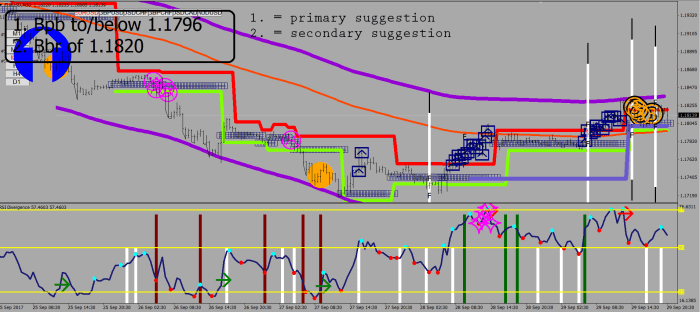
(Bpb = Buy PullBack, Bbr = Buy BReak)

Chart is on 30 minute.

Download the RSI divergence routine from my blog – you’ll find it under the posted articles.

Set the period to 16 and adjust two of the fixed lines, the 77 to 73 and the 23 to 26.

Dowload the _Primary_Secondary routine as well.

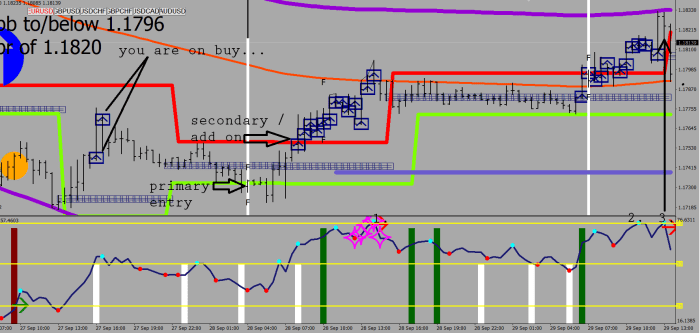
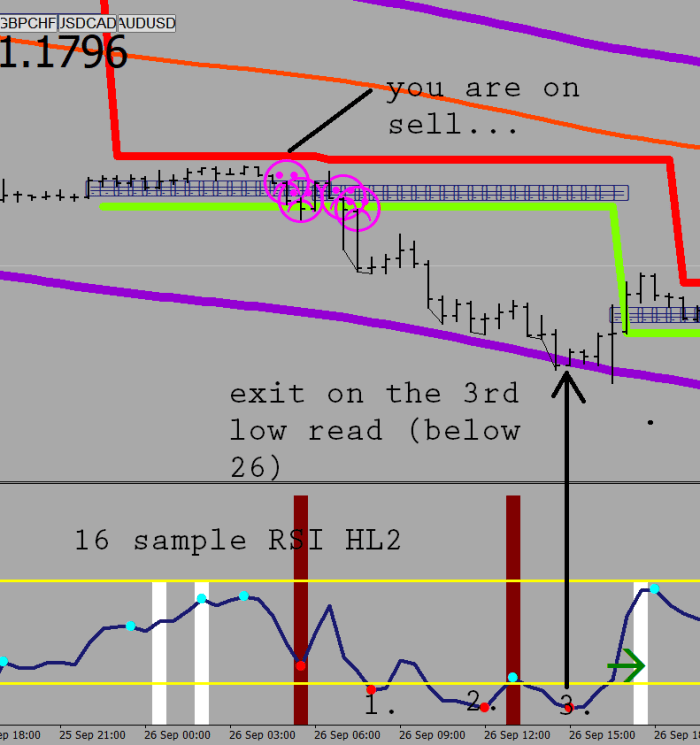
The logic behind the label is the following. It will look for the last buy/sell signal. If it is a buy, it will suggest a primary buy at or below the latest 30-min Weight minus 12 pips,  which would be the preferred value for a pullback, and a secondary, break out entry to add to a position or if you missed the first turn.

You can then hold safely until the 3rd high RSI read (above 73).

EUR347

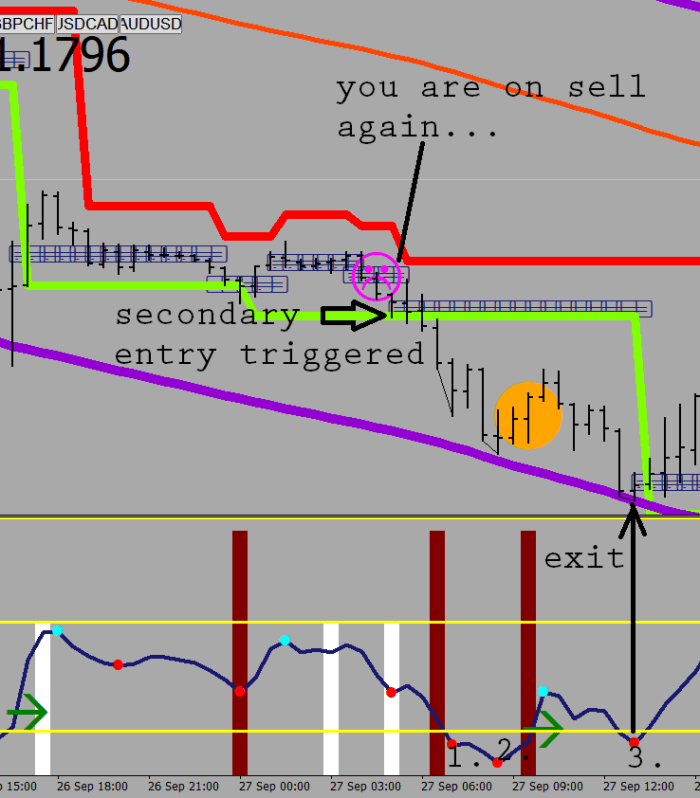
On the above picture you can see that there were 2 more opportuinities to enter at the high base, again at/around the green line and the add on at the red one. You will not have the plots, but you would see the numbers and the direction in a form of a label.

Just the opposite would be true for the sell side.

You should be able to get away with a 20-pip stop for the most part, and I think that’s pretty awesome…

EUR345

EUR346

About Market Making

There are dolphinately secrets to trading.

First and foremost: not all trading is created equal.

Futures trading is a clean thing. Zero sum means that to buy a contract someone has to sell a contract. There is even delivery upon expiration.

People buy stocks based on supply and demand bets: they hope to get a piggy ride on the excessive interest / greed of people, on a bet that a major company is buying up shares or that there is inside buying to gain more control or simply to drive up the share price before cashing out.

Just like Benioff selling some to reap the benefits of the cloud mania while alive.

There are others that intend to keep control, Zuckerberg and Bezos are conscious of not giving up share, and if you are at their level, you really do not need anything in life: your salary can buy you anything that is not already a write off for the company.

Apple is famous for faking previous meetings that did not happen to exercise back dated share buying options at a much lower price when things are running hot for an instant kill.

As for Forex, de de-centralized nature and no limitations breathe an unlimited number of brokers into existence.

Their Market Makers run different programs based on hype and no hype, and they do not even need to make any real transactions, but most likely would do it in a 15 minute window – after hours – to re-balance their books a bit.

We are gonna skip the lesson called: “there are only three real currencies in the world, USD, EUR and JPY. Cryptocurrencies are in fact commodities.”

Market Makers are the ones feeding the snake. When there is high demand in one direction, someone has to capitalize on this with a delay, meaning, first they pull down their pants. They will have made their money in both direction by the time the tide makes the full circle.

If you dared to say that there are no market maker levels, but boy, would you be wrong!

EUR052

About 70% of all trading is high and low tides called into existence by the Market Makers.

The only trace they leave behind is velocity, ferociousness.

During hype they run an AT market fill routine, and the imbalance in the supply and demand would do the rest. This would come with a sudden burst.

To detect for these bursts, you can use Heiken Ashi candles: wherever price was not able to center is where they started the program from.

Heiken Ashi plots slow down the MT4 quite a bit, so my system is much simpler than that.

That’s a wrap for this morning, I just gave back my badge to the security, I’m out of Bloomberg for good and looking forward to getting a new life.


Going the Distance

I promised the right thinking, and you get here nothing less.

The top was called perfectly by

36 Only V1.2 – in the downloads.

The second break was the key yet again.

I had to adjust my thinking and the RSI Divergence 4H routine ultimately to give me the 1-2 (starting and finishing exhaustion) signals in the right place. The new version is available from the previous blog post.

The improved thinking is this: exhaustion is not about crossing a level, it is about going the distance, regardless of the movement direction on the oscillator.

EUR334

The accuracy with the combination of this knowledge and the Market Maker levels is mind blowing.

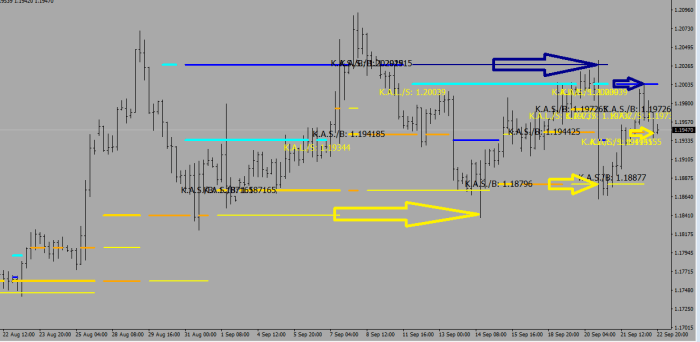
I was actually short yesterday, but only 1/6th of my full size at 1.2028, for the next Market Maker level up was 1.2027 and the highest tick was 1.2034 – I was within 6 pips of the peak!

I have been not even a full step behind of the ultimate knowledge. The distance just got slashed in half.

I will have some routines for sale in the future such as the Market Maker levels and some automated trading routines as well.

RSI Divergence 4H

This version is a space-saver with added CI (consolidation strips).

The idea is that a reversal happens upon a divergence and a divergence sets up after beating an exhaustion level.

You make your own rules with this one.

Green strips printing meaning upside strength, yet it can also be the last flame to the upside.

Often, an opposing colour strip starts a move and the next one repeating the last colour ends it.

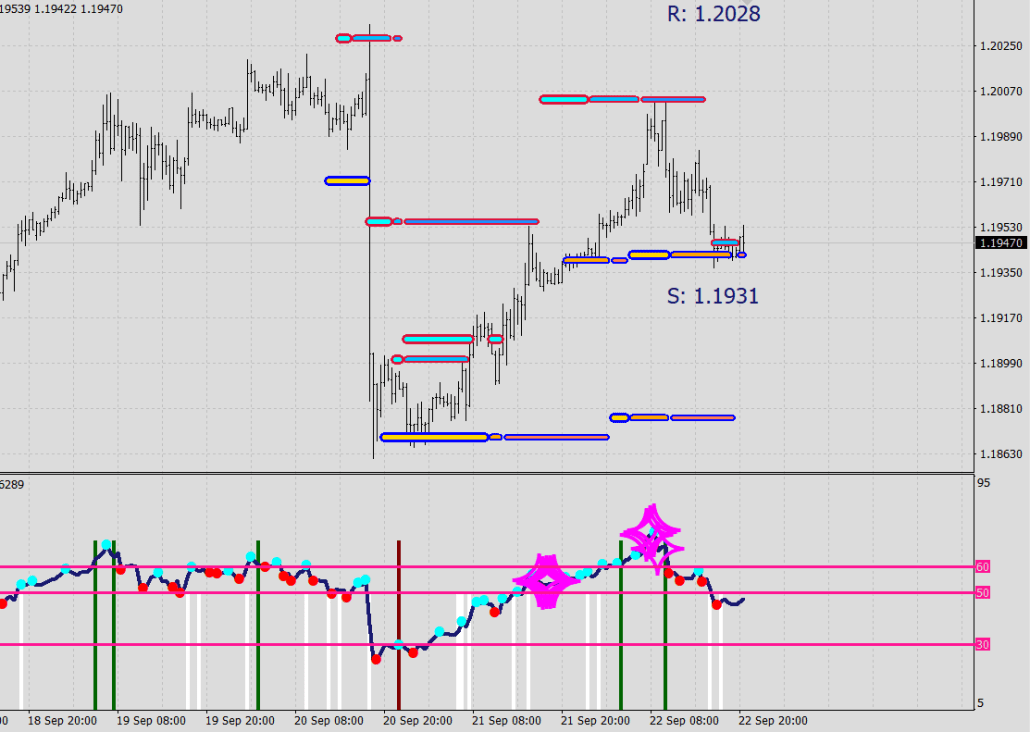
Be careful with wanting always to defy them. Evaluate the range on the RSI, did it go all the way from top to bottom/bottom to top (2 yellow lines plus) to make this a terminal move? Did it get high/low enough? (above/below the last yellow line)

EUR000

– white strip: full charge – consolidations wrap around this level, I call it weight at times, when dealing with the (High+Low)/2 read, if there is no trend in place, a re-visit is a good bet
– green strip: upside exhaustion ”
– maroon strip: downside exhaustion

I did something here that I have not done before: some exhaustions are being filtered out for being “insignificant”

_RSI_Divergence_4H V1.2

GBPUSD053

AUD043

As for re-visiting: both the white and the coloured strips are potential end points, and so they are points of interest. Bear in mind, that when one timeframe is becoming exhausted, the same moment a different timeframe may become fully energized. They are all terminals as well as starting points, call them spinning points.


Two Dojis Mine

Sure, I Do Not Want What I Haven’t Got… (Sinéad)

And all I Have Is You… (U2)

As Prince once said: Nothing Compares To You…

Three Babies Mine Two Dojis Mine

Correction:

The handful of visitors that I currently have surely won’t mind some habitual craziness every once in a while.

This is the suppressed poet coming over me, it’s that crazy dude with too much to say and has not yet for some reason re-launched his poem collection (after the multiple demises of multiple websites) under that imaginary blog, what was its name? Oh yes, he remembers now…

SYLLA-BELL

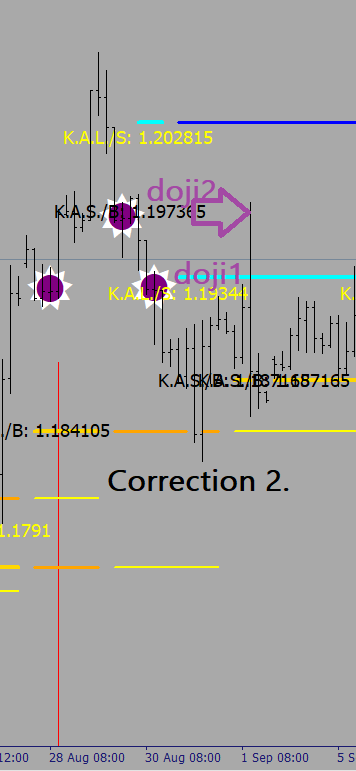
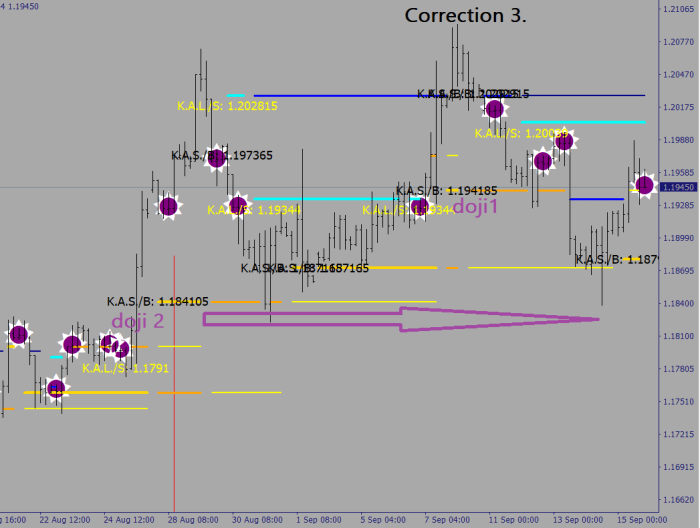
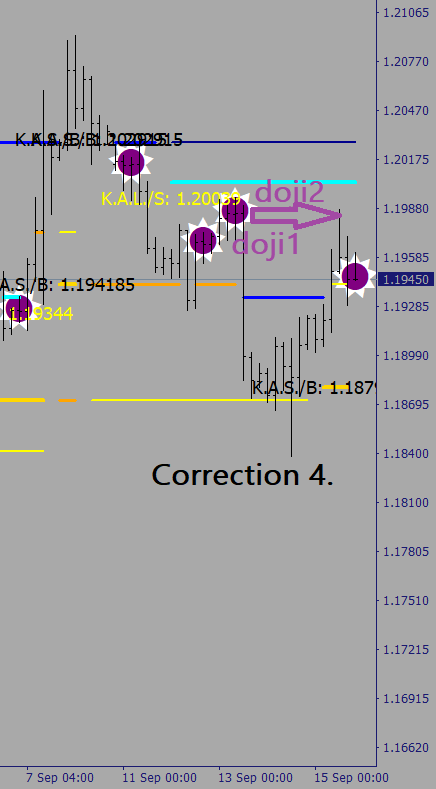
So, back to the correction part: figuring the target can be as easy finding once, twice a lady doji.

Figaro Figure 1-4.


EUR329

EUR330

EUR331

_Dojis

Don’t forget to flag Chart on foreground under Properties/Common.

Play around with pip values if you like.

By the way, I am perfectly sober while belching up associations like these. Perfectly normal? That’s up for a debate.


36 New Version

2nd update is here.

I am calibrating this thing on 4 Hours.

I want something that fits and is accurate for EUR/USD as well as for GBP/USD.

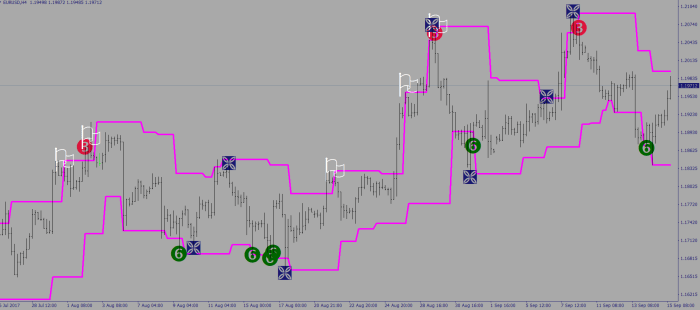
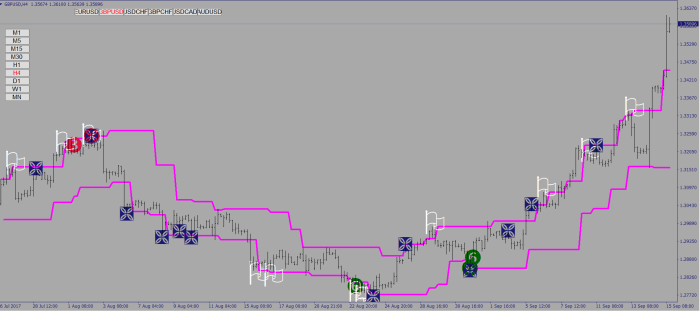
Here is how the V1.2 shapes up in the last 230 sample:

EUR327

GBPUSD052

V1.2 has 3 conditions for sells, 4 for buys, and the new filter takes into account the freshness of the turn – the essence in James Bond style would go like this:

  • One Break is Not Enough

Up in the Downloads now.