RSI2 Wave-Reading Expressions

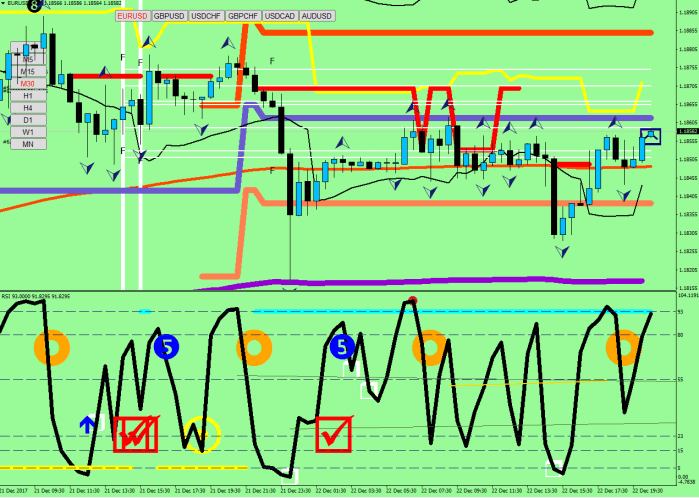
What I would not be getting into is talking about the possibility of re-arranging the time line by grouping up all happenings to a wave close regardless of the duration it took to develop, for this would require clean, real time data feed that does not come cheap and a whole lot of programming say in Python. But the idea is given, the partially digitalized readings dictate a rhythm that totally disrespective of the clock.
EUR501

I have promised some definitions and so here they are. They are current as of today.

If you start scrolling back on the posted RSI2 indicator, you must know this: the readings before the 4h divergence would not had been plotted before the divergence was set, for I use the last direction as a filter for the plots.

I am currently discussing the upside here with the 4h direction showing positive.


RSI2:

I have already posted the

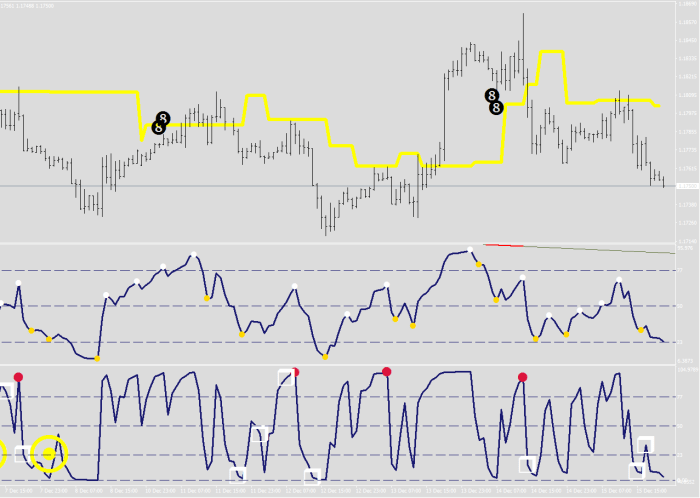
8-Ball conditions, but here they are again. For plotting the #8-s I use 10 pips displacement, but when calculating with the values (such as for the CIA label, I have the displacement decreased to 5 pips.

if (iRSI(NULL,0,2,PRICE_MEDIAN,i)>96.5 && Close[i]70) marker2[i]=High[i]+.001;

if (iRSI(NULL,0,2,PRICE_MEDIAN,i)LowBuffer3[i+1] ) marker2[i]=Low[i]-.001;


Sign of Stength:

RSI2[i+1]>50 && RSI2[ArrayMaximum(RSI2,8,i+1)]==RSI2[i+1] && RSI2[ArrayMinimum(RSI2,10,i+1)]<12 && RSI2[ArrayMaximum(RSI2,9,i+1)]direction ) strength[i]=23;


Too Fast Buying / Failure or #5 condition

((strength[i+1]==23 || strength[i+2]==23 ) && (RSI2[i]>85 || RSI2[i+3]>80 ) || (RSI2[i]80 && RSI2[i+3]<40 && strength[i+4]==23)  ) fail[i]=73;


End of Wave signal = Down Cross

(((RSI2[i]<44 && RSI2[i+1]>93) || (RSI2[i]<44 && RSI2[i+2]>93) || (RSI2[i]<44 && RSI2[i+3]>93)) && !DX[i+1] && !DX[i+2])

DX[i]=True; oval[i]=72;


Sliders aka skid marks (oiling up the road to a break out by trapping some people)

RSI2max[i]=RSI2[ArrayMaximum(RSI2,5,i)];
RSI2min[i]=RSI2[ArrayMinimum(RSI2,5,i)];
if ( Period()==30 && ufractal[i]==1 && i92 && RSI2[i]<92) slider[i]=93;
if ( Period()==30 && lfractal[i]==1 && i<200 && RSI2min[i]8) slider2[i]=8;
EUR518


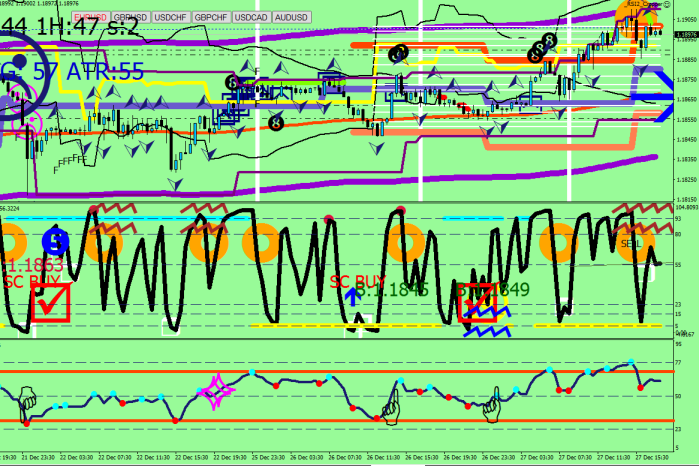
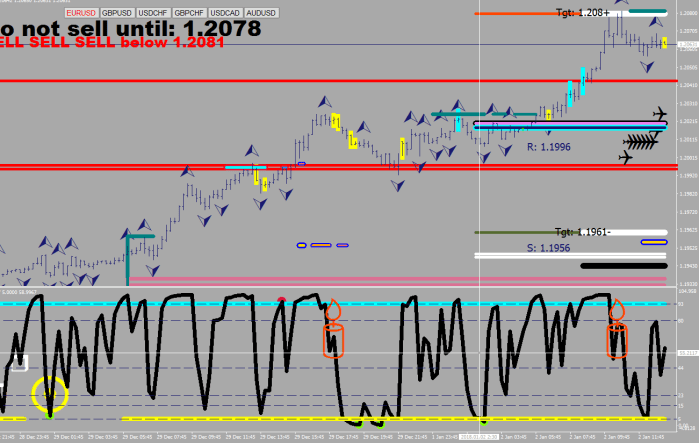
candle flame burning out

Period()==15 && RSI2[i]65 && RSI2[i+1]97 && RSI2[i+5]>97 && RSI2[i+6]>97 && RSI2[i+7]>97  fifteenout[i]=73;
EUR535


As per bonus, here are the

4h momentum divergence expressions:

if (iLow(NULL,240,i)>=iLow(NULL,240,j) && exit4[j-1]==EMPTY_VALUE && MACD4[i]<MACD4[j] && MACD4[i]<0 && MACD4[j]0 && iFractals(NULL,240,MODE_LOWER,j)>0 && RSI4[j]<35 && RSI4[i]j && iRSI(NULL,240,2,PRICE_MEDIAN,j)>.5 ) exit4[i]=iLow(NULL,240,j)-.0002;
if (iHigh(NULL,240,i)MACD4[j] && MACD4[i]>0 && MACD4[j]>0 && iFractals(NULL,240,MODE_UPPER,i)>0 && iFractals(NULL,240,MODE_UPPER,j)>0 && RSI4[j]>75 && RSI4[i]>RSI4[j] && ArrayMaximum(MACD4,50,j)>j && iRSI(NULL,240,2,PRICE_MEDIAN,j)<99.9) exit4[i]=iHigh(NULL,240,j)+.0002;


Hands

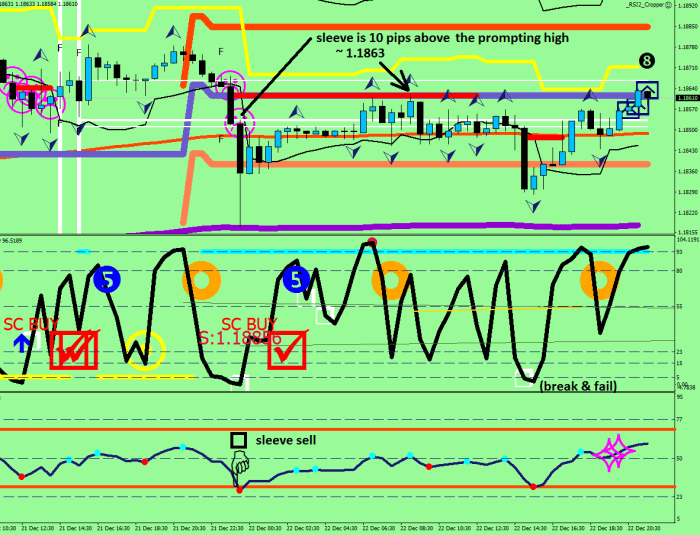
Derived from RSI 8 readings, mainly for 15 min+ (t3_Oscil is the array for the RSI readings), (ultra fast moves) – buy / sell the sleeve = 10 pips away bewyond the secure point is a low risk area to make a bet on the direction of the sudden move :

Hand up:

if (t3_Oscil[i]<t3_Oscil[i+1]*.6 && t3_Oscil[i+1]t3_Oscil[i+1]*1.4 && t3_Oscil[i+1]>32 ) hdn[i]=t3_Oscil[i+1];
EUR506

At or below 15 minutes I had to reach after a different trick finding the base value – the 6 period high / low :

PriceL[i]= NormalizeDouble(iLow(NULL,0,iLowest(NULL,0,MODE_LOW,6,i))-100*Point,6);
PriceH[i]= NormalizeDouble(iHigh(NULL,0,iHighest(NULL,0,MODE_HIGH,6,i))+100*Point,6);


Still RSI 8,

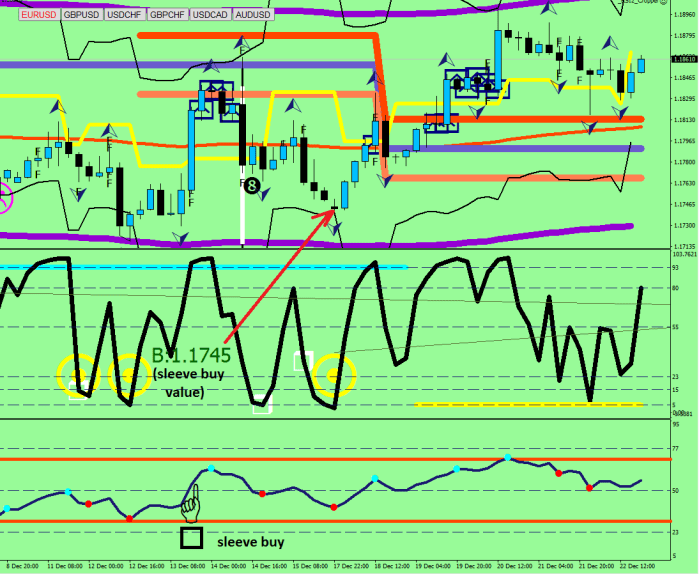
Scurry readings are fast moves to alleviate much too oversold/overbought conditions – measured on a 5 sample span. You need to disregard these if a hand recently was prompted in the opposite direction. Since a Scurry Buy is happening against the real direction, it is in effect a sell into rally.

Scurry buy:

t3_Oscil[i+1]t3_Oscil[i+1]+40

Scurry sell:

t3_Oscil[i+1]>75 && t3_Oscil[i+6]<t3_Oscil[i+1]-40
 

EUR507


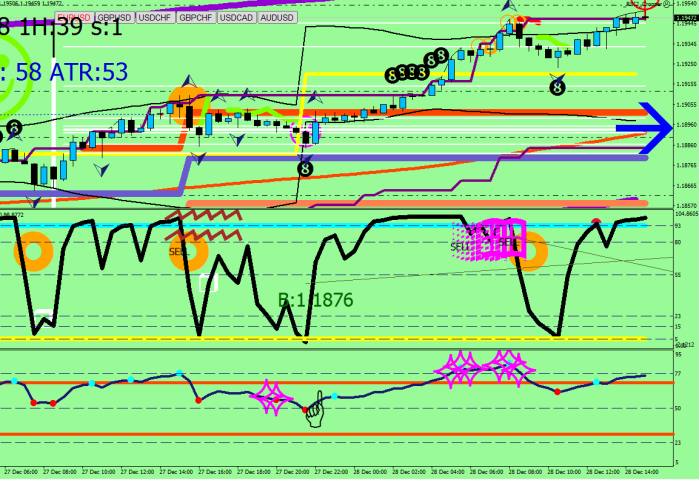
Too Strong (better sell) – the window of selling into strength opportunity:

RSI2[i+1]92 && iRSI(NULL,0,16,PRICE_MEDIAN,i)>80 toostrong[i]=80;
EUR521

Boot Camp #5 – Timing is Money

A few things here first for I cannot remain without comments any longer.

I read this response tweet today by A.K. who is famous for bragging about his 90% fundamental, 10% technical trading method.

It was referred to Bitcoin, but overall was on an attack on T.A. itself.

“err no if you think something is goin down 100% or up 20,000% ,WTF does a candlestick or a moving average or an rsi or a doji or a wave have to do with anything? It is total BS.”

I personally think that any data in charted format can help with gaining more grasp on what is happening, and a technical indicator can help you with determining optimal entry and exit levels, hence they are providing you with an edge in the market.

I do understand the conviction part, I get it.

I have the following conclusion to draw from this: Raj must be trading options with your firm on A “fundamental basis”. Apple fundamentally is a pure straddle… Or was it a saddle?

Craig Severson is famous for his Iron Condor trades, which are non-directional plays. Yet, as supplementing income he would not pass on an good RSI2 trade, where ANY instrument closes with a below 2 RSI2 reading and play the long side immediately i.e. spy via the 2x leveraged SSO until the RSI2 gets back above 70 to get out and book profits (not that different from the Trin trade). Why would you pass out on the aid of the RSI?


Tell me, why not utilize something like my Channel Target indicator?

EUR484

Is it a disadvantage to know a day ahead until when it is worth to hold your short/long for after a re-entry into the channel? What is wrong with making money easily? Of course, you may have X-Ray vision that can time travel into the future, and so you would be in possession of all these levels otherwise, on a 90% fundamental basis (a Singapore driver license definitely a good qualifier for this).

While we are at the topic, it is worth mentioning that the quoted person is selling education (the oldest scam in the book) with promo movies about vacation travels to kick off the pricey tuition period. Live it up, people!

Anybody who show you cars, vacations, wealth, watches, brags about money are scammers and so they should be avoided. If you hear anybody mentioning “price action”, run away immediately! As Simple Ton put it, “What happened to people’s brains? Did they turn into Mash?”

(Don’t even get me started on that low life Greg Secker…) John Carter? A seasoned sales man who can provide for his gambling habits in creative ways.

What about me? I share my knowledge and findings for free on this blog that I’m paying for. I code indicators and automated routines to aid my own trading, I share most things at no cost, and others I would only give out at for a small price. No one has ever purchased a single indicator from me, but that is not my loss.


Ok. Grumpy part over with. Different tone now.

Today you get to see the sun. We’ll pay a visit to the beach. Bring your camera too!

(after the arrival)

Let’s take in the scenery! A panoramic view everyone!

EUR486

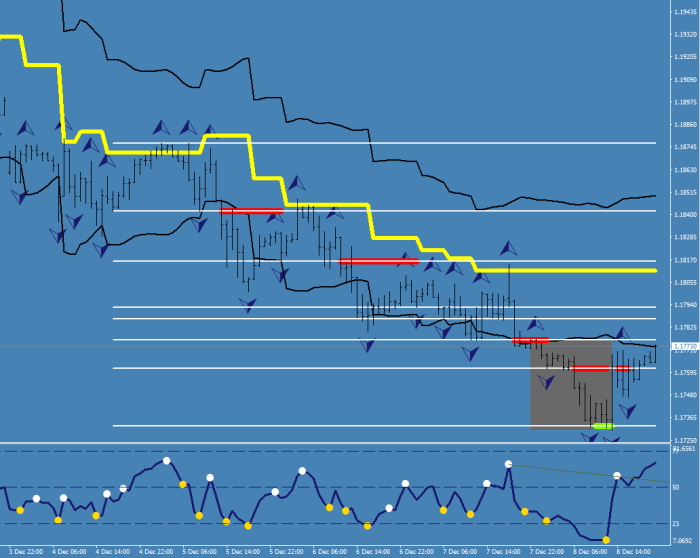
At once so much motion, the tide… is currently going out, the waves are full of strength!

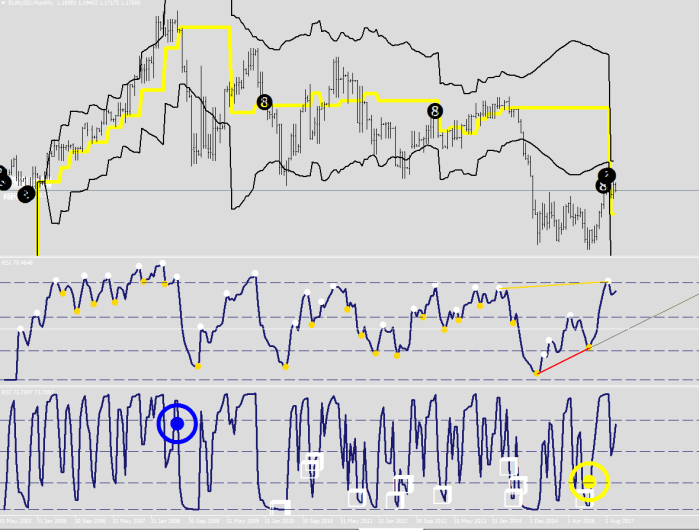
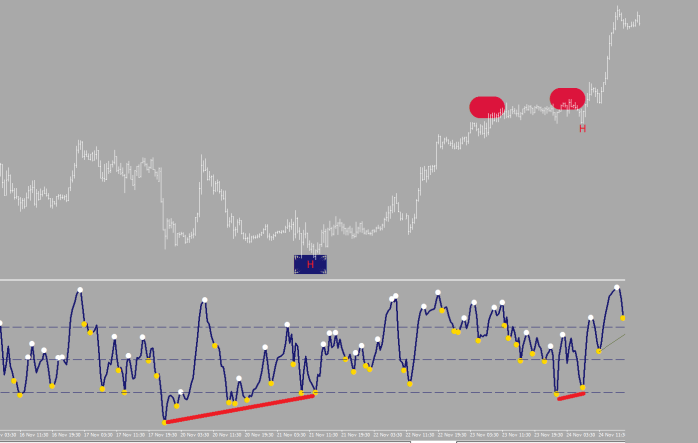
The chart window shows the 4h divergences , the blue and yellow bulls eyes. These mean that some institution purchased / sold and by those points, this is obvious, measurable in the form of a momentum divergence.

The indicator window plays around with the idea that you may not need a lower low / higher high for a secondary divergence, it is enough to close up on that low/high.

You, as a Forex trader are nowhere on this scenery. When you buy or sell, you simply make a bet at your broker about the guessed direction of the price. You do not purchase anything just as a person who is betting on a horse, does not buy any piece of the animal.

If you happen to trade Euro futures, at least you purchase something. The right to sell or buy the Euro by a given time.

Once a 4h divergence was set, some institution stepped and took a position. This may be for speculative reason or because of getting out of a trade or simply to park the money in a lower risk currency temporarily. Either way, this would show up as a momentum divergence.

Now, we capture images of the waves. Set your exposure rate to 30m, gentlemen!

EUR485

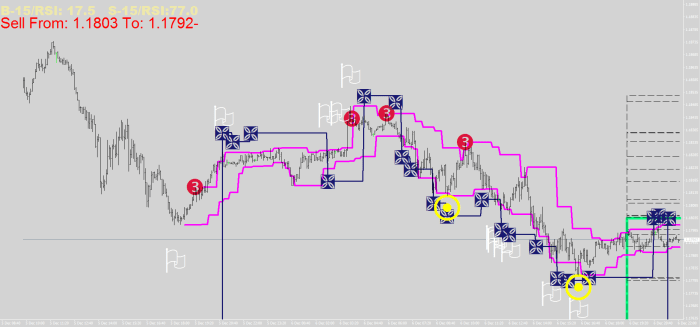
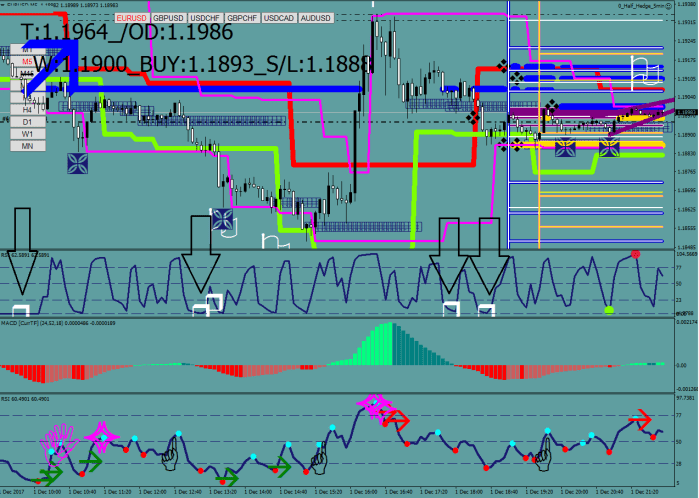
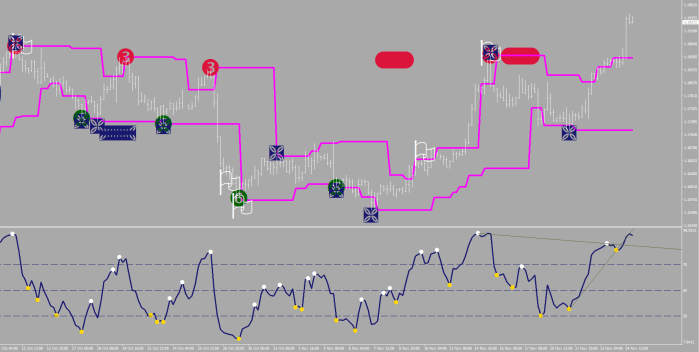
What do we see here? Morse? Yes! There are S.O.S. signals. No, they do not mean Save Our Souls. They mean Sign Of Strength. A sort of a prelude before the triplets.

Since we had a yellow 4H divergence, until that given level is broken, we are only interested in surfing the waves to the upside. Of course there can be another, opposing titan stepping up to the plate or the institute itself can roll out/reverse the position, but the price’s relationship to one single level would remain obvious.

Once you have an SOS sign, you want to get in on the coming wave as close to the previous low (that the SOS wave started from), as possible.

Then you need to stay in, but not over stay; wave 2 would be printing the left shoulder, and wave 3 would be the head/failure.
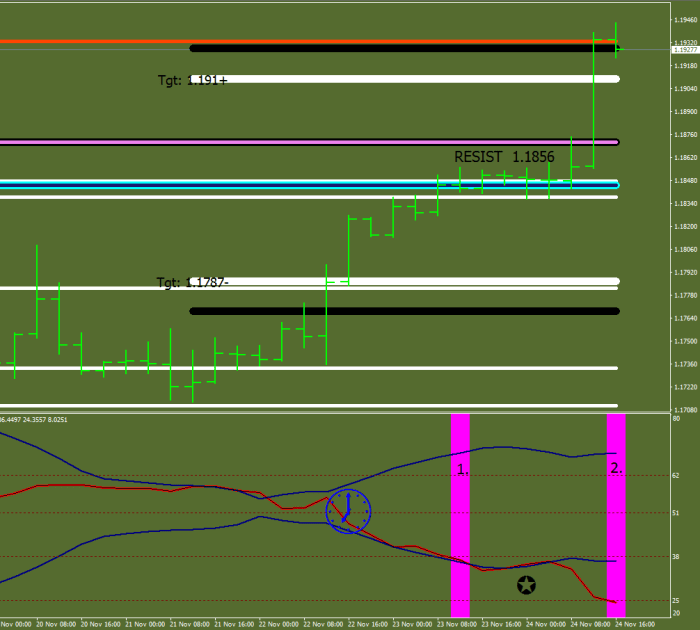
I just made an EA two days ago that licks through the open positions and hooks them up with a stop loss when it spots the 3rd push coming on strong (it reaches after the previous 15 min low minus 2 pips upon the fact that the position would be in gains by at least 5 pips – to pay for the dues of course).

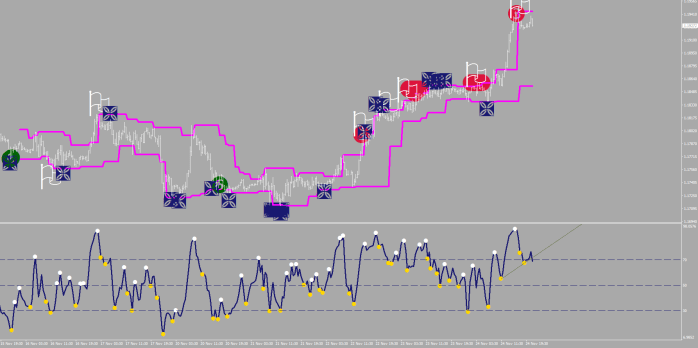
As you can see, it is possible to know which wave you are in, and these end-of-wave signals can be plotted as well as the arrows for where the stop loss should be ratcheted closer.

EUR487

I had 8 years of trading and asking an infinite number of why-s and trying every idea under the sun that yielded me this. I suggest you to listen, even if all of this costs you nothing but your attention. It cost me 200k in US.

Should have purchased a supercar, eh?

red check marks for SOS long entries…

EUR488


The 8-Ball Levels

8 ball in here stands for

-> the one to tackle and

-> hard to crack

The idea is simply this: RSI 2 tracks the sudden moves, RSI 8 the regular ones.

If something is suddenly peak overbought within the overbought field, that location would remain something of an extreme, a divider. Same thing on the oversold side.

So, you are going to see these appearing from now on, and may make it into the current read field.

if (iRSI(NULL,0,2,PRICE_MEDIAN,i)>96.5 && Close[i]70) marker2[i]=High[i]+.001;
if (iRSI(NULL,0,2,PRICE_MEDIAN,i)LowBuffer3[i] ) marker2[i]=Low[i]-.001;

EUR470

I guess if my last name was Carter, I would have come up with a more superstitious name for this, such as Voodoo Levels.

EUR471

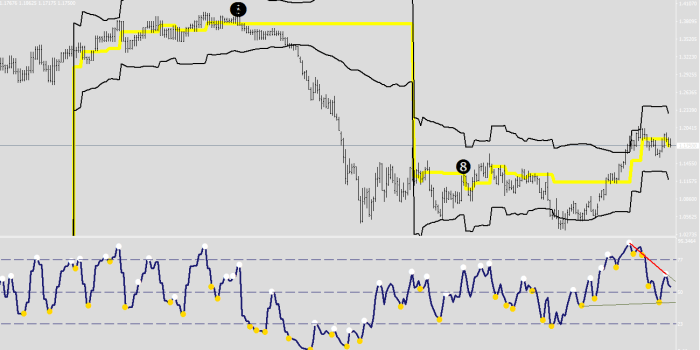
This of course takes us back to the EUR gap up of 2017.

Why was it necessary?

EUR472

EUR473

EUR474

Boot Camp #4 – Lock Step

Now you have an understanding of how the market is jay-walking.

As a next step, we need to get your movements right.

First thing is that there is no general trading. Buying and selling without any system is merely scrambling about, and this kind of hit and miss “trading” brings shame to the “trade” in general.

Optimal trading is when the trade does not move much against your direction (minimal stress) and you are in it for as long as it is feasible (maximal gains).

The trading I am about to teach you is an optimal one.

You have to be patient. You must wait for the right condition. Always.

Get the bias right: Download the Compass Line for free.

You already know that the heads are the targets.

What would be your entry then? A head? Wrong!

Your entry is always a failure. A failure at the left shoulder.

You need to make limit buys with buy stops: when the price passes by the left shoulder, you must place a buy stop above the price. (Or simply buy a Reversal EA routine from me for $99 – my routine is actually following the price 2 pips behind until it punches into it.)

Once you have the entry right, your exit would be:

– for half position the first deeply oversold (80) hourly RSI(8, hl2

– for the remainder, you want a momentum divergence on the 4h chart (later about this)


Here is a little preview on how the left shoulders operate. I made this for 1h or 30m.

_Compass_Left_ShoulderV1_1

EUR452

Homework: how much of your shorts should you have covered at 1.1732?

Instead of closure to this lesson now I’m going to show a piece of a conversation that I conducted with an imaginary student today.

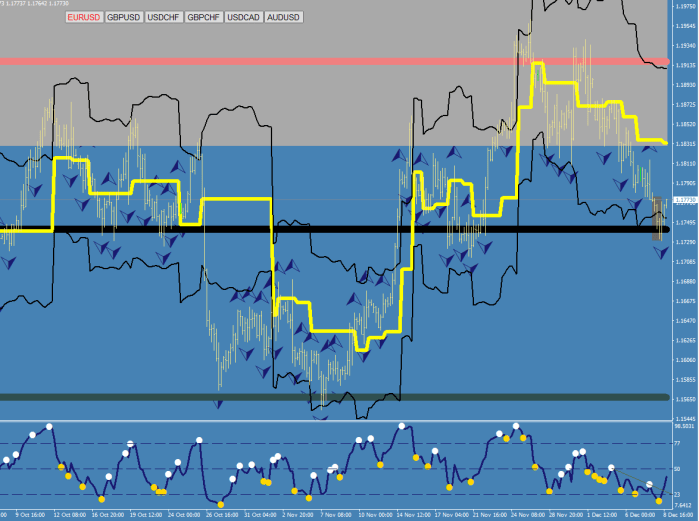
— Teach, about the Euro sell off lately. Instead of over analyzing things, would not be better simply to notice the failure/divergence at the Deeply overbought level of 1.1918 on your Comfort Levels indicator and make a bet that price would correct back down to the overbought neckline of  1.1742?

— Bravo! That’s exactly what happened. You can think well on your feet. You would make an excellent fund manager. The percentages, such are 5, 10, 20% movements are things to keep an eye on and make decisions by. These numbers are for real, unlike the Fibonacci ones that are only in your head. I started writing my memoir about trading. I have not settled on the title, but it has a subtitle already. “From Fish of Blood to Blood of Fish”. I would like you to be the first one to read the first chapter.

EUR453

eur454

Compass Line

Suggested for 15m and above, 1h & 4h makes most sense.

It may seem like the Minecraft / Roblox version of the Bollinger Bands, but it isn’t.

The idea is to have a directional bias based on which side the price is on: above the line is bullish, below not so.

It is fractal based, it has an RSI filter (it picks between a slightly displaced support and resistance line resulting in one continuous line) and the “bands” are 3 of the previous 21 sample ATR’s distance away. This to see a break away move and/or spotting the price at a stretch.

EUR446

EUR447

EUR448

_Compass

EUR449

EUR450


Momentum Divergence

Premium invention. Suggested use 5m-4h.

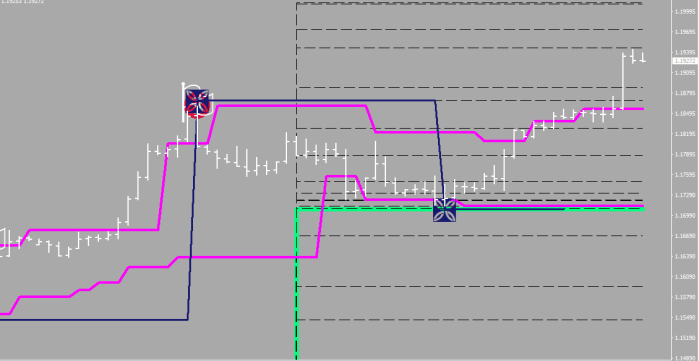
I know, I have been giving away various versions of the 36. The latest version had the RSI divergences included in it, and briefly I made available – at no charge – the D “DISPLAY” version that would call out the last head on the given time frame and help you out with what the next aim would be.

I am proud to present my newest upgrade,

– 36 Only V1.3 VRLDM –

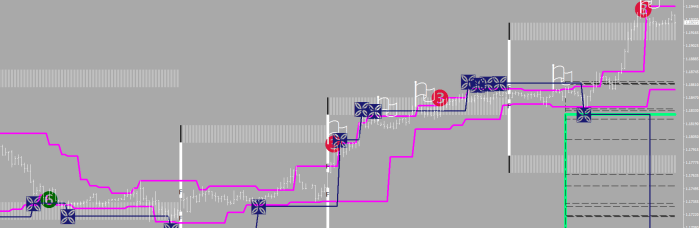
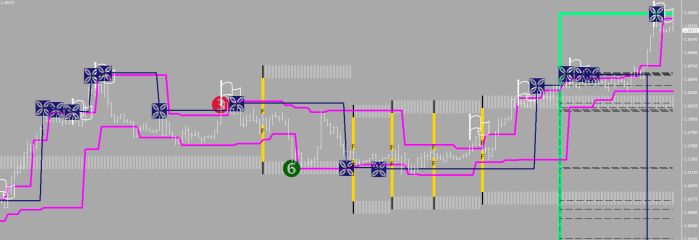
that has the long sought EXIT condition for any trade is now included. The M stands for Momentum at the end, yes, there is MACD involvement, but a lot of sophisticated tricks (filters) on top of that. Visually they are the blue and yellow bull’s eyes.

VRLDM01

It is for sale. $78 a piece. Of course it is worth it.

VRLDM02

VRLDM03

VRLDM04

VRLDM05

You’ll get future updates of course in case something changes.

Contact: macdulio@yahoo.com


Three Things

1.

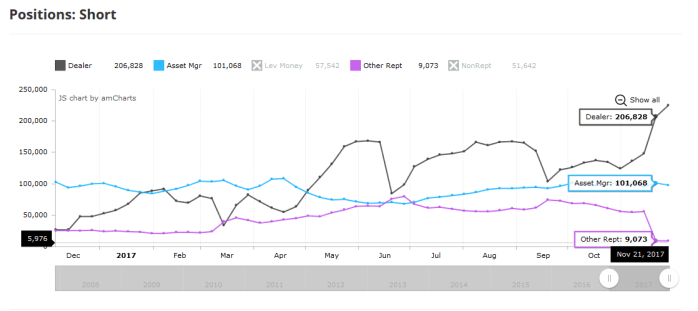
Small speculators dropped their shorts between the 14th and the 21st of November (report dates), and this should stop prices from progressing significantly higher for now.

small

2.

Examples of how-to use the Market Maker Lines DC.

MML_DC

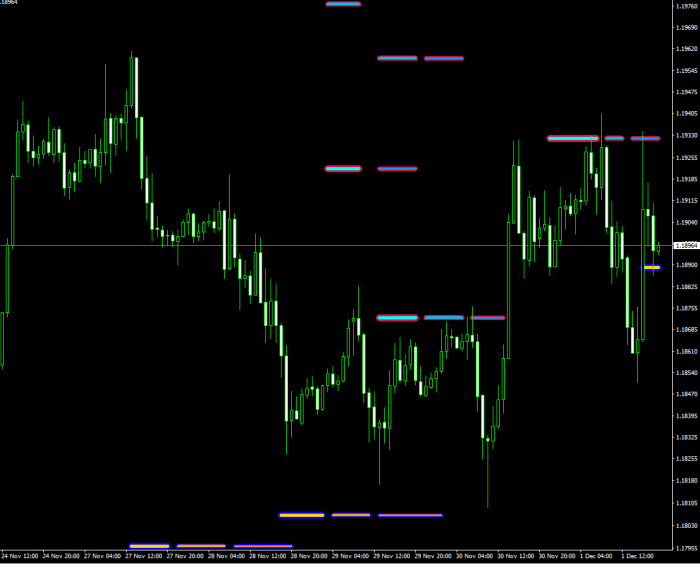
(the cyan to blue pads with red contour are Market Maker resistance levels, the yellowish/orange pads with blue contours are Market Maker supports.)

The very reason I picked up more longs by the close was the appearance of the support print at 1.1890.

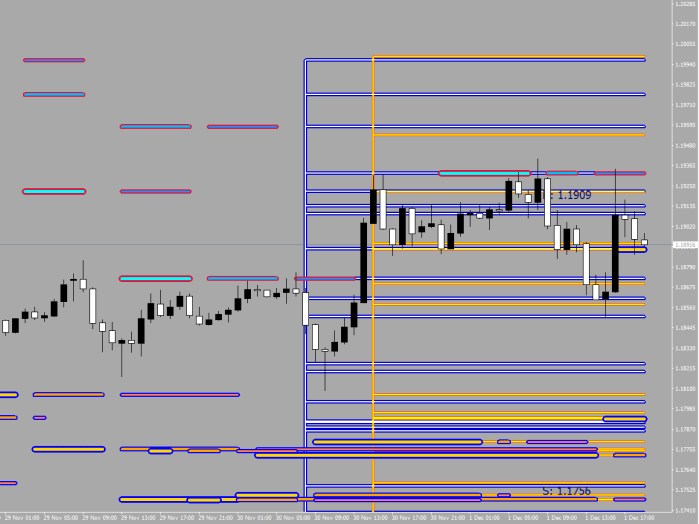
You can see how easy it becomes to name a target: you open a position and then you hook them up to a resistance/support (depending on buy/sell) to get out by say mouse click and pull.

MML_DC2

I don’t want to go into deep details of my auto hedging strategy, but as main points, here is this:

I engage in 2 kinds of trades only, Core trades and Casual/Chance Trades. Core trades are triggered by RSI divergences, while casual trades are prompted by low time frame adjusted RSI readings. The Core trades have RSI divergence exits and stops, whilst the Casual ones get triggered throughout the day by my auto trading routines and since they have no stops, they may also get a hedge position, and so when I get around to it, I would have to take them off together either with gains or with losses.

I can arrange for the MM DC for you at a price of $175.

I have in mind opening some shop here, where many of my auto trading routines would be available.


3.

To give you something today, here is a semi-abandoned project, that has one feature, the “crack” that is note worthy:

The white squares are the violations of the ATR support, and after seeing 2 of those in a trend you can feel free to go in.

EUR431

_divergencepetr_s6

Boot Camp #3 – When You’re Ready

Last time we discussed the importance of a good shampoo: the wash out and the immediate go.

_36_Only_V1_3RL

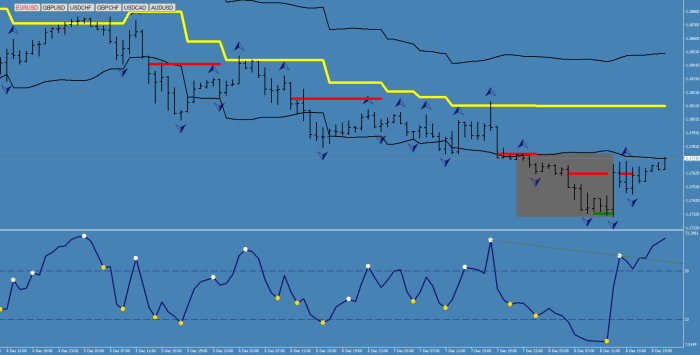
This after hours version plots up to 20 of the last heads as horizontal dashes and high lights the last one (in green). If you adjust the max lines to 1, that’s going to plot the last+1 line making the most current range clearly visible.

EUR417

Leaving the max lines at 20 would reveal to you the cause for pause on a 4H:

EUR418

We have always known what everybody was thinking when entering the market. They had money on their mind.

Now, that we’ve arrived at the conclusion, that not to lose your mind, you need to loose the head, let’s get going!

Get your boots and we’ll meet at the Camp.

The location of the camp sites is determined by how much time you have left before the night sets in. The camps are not the targets, the targets are the heads, but the camp sites are perfect for a relief, lightening the load, and in the morning you can pick up your left luggage and perhaps some extra refreshments.

To calculate the approximate distance of a camp, you need to know how much progress can you be making on average on foot per day = AVG daily ATR. This is based on the last 3 days of walking distances.

EUR419

This was your orientation for the day. Change the colors if you want. F is of course Fully Recharged after proper rest & digestion.

Over and lights out!

_Camp_Sites

EUR420

EUR421


Boot Camp #2 – Knees and Toes

Warming up comes next.

Use your head, which of the following is true?

  • The market exists to transfer wealth from those in the know of of the mechanism to those who don’t know.
  • Trader / Day Trader are synonyms of looser / donor.
  • Feeling good is part of the appeal for wanting to come back; you can win any fight (trade) –  and be happy temporarily, but you will always end up losing the war.

Transferring wealth starts with entrapment and squeeze the trader until their bet / capital is taken.

It is all in the head!

You can find the modified Stochastic Bars in the downloads, but all you really need is a plain ol’ RSI 8.

_divergencepetr_s7

The first head with the lengthy divergence is easy to spot.

EUR410

Would you have found the second one?

For the left shoulder you need an oversold RSI (<30) and for the HEAD you would need one that is just out of oversold with price close to matching or exceeding the measuring low.

In order to start making money:

You need to find the trap (jefe/téte) and bet that the market is going to be running away from the area.

You need to stop making multiple trades per day, in fact, most of your trades should be more than a few days long.

The 36 would plot some of the heads (butterflies) for you (based on stochastic divergences), and now there is a boosted version (V1.3R) with RSI divergences added.

EUR411

EUR412


Boot Camp #1 – Exercise Your Eyes

Tonight’s first exercise:

Print out the following image as large as you can.

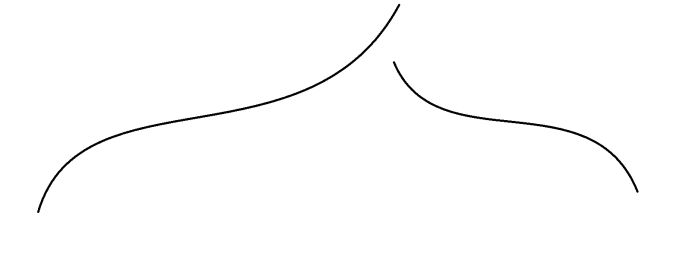
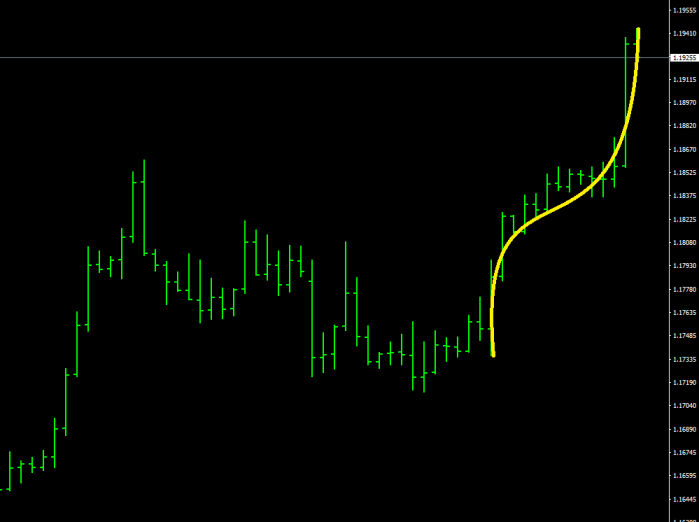
Write on the image the following: THE SHAPE

Hang it on the wall

shape

Stare at it every day for 10 minutes.

What did I want with this?

Can’t remember. Doesn’t matter.

EUR408

The first (buying) exhaustion is getting the move started. The second is ending it.

EUR409

_Choppiness_CA

What comes after a terminal move?

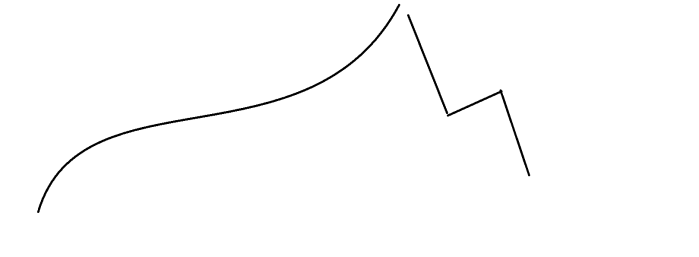
I can only guess…

shape2