The extended time play is capitalizing in on a daily embedded stochastic condition.
Breaks in the market are buys to dump somewhere beyond the daily Bollinger – or the target I’m about to suggest. Rinse and repeat until the embedding persists.
(Yet another Decisive move got storno-ed due to too deep pullback.)
Tell me that it isn’t an important piece of information, that sellers just got trapped – as shown by Axel H: S-Box.
Or that it isn’t useful to know where the Ionosphere line is and be able to aim for it in real time.
/////Long Target - Code 87 AXEL H

if( OrderType()==OP_BUY && OrderStopLoss()==.87 && OrderTakeProfit()!=NormalizeDouble(iMA(symbol,30,64,0,MODE_EMA, PRICE_MEDIAN,0)+870*Point,4) && OrderOpenPrice()<NormalizeDouble(iMA(symbol,30,64,0,MODE_EMA, PRICE_MEDIAN,0)+870*Point,4)-40*Point
 )
       { OrderModify(OrderTicket(), OrderOpenPrice(), OrderStopLoss(), NormalizeDouble(iMA(symbol,30,64,0,MODE_EMA, PRICE_MEDIAN,0)+870*Point,4), OrderExpiration());
          Print("LONG Target Set to AXEL H @ "+DoubleToStr(NormalizeDouble(iMA(symbol,30,64,0,MODE_EMA, PRICE_MEDIAN,0)+870*Point,4),4));}

/////Short Target  - Code 87 AXEL H

if( OrderType()==OP_SELL && OrderStopLoss()==8.7 && OrderTakeProfit()!=NormalizeDouble(iMA(symbol,30,64,0,MODE_EMA, PRICE_MEDIAN,0)-870*Point,4) && OrderOpenPrice()>NormalizeDouble(iMA(symbol,30,64,0,MODE_EMA, PRICE_MEDIAN,0)-870*Point,4)+40*Point
 )
     {  OrderModify(OrderTicket(), OrderOpenPrice(), OrderStopLoss(), NormalizeDouble(iMA(symbol,30,64,0,MODE_EMA, PRICE_MEDIAN,0)-870*Point,4), OrderExpiration());
           Print("SHORT Target Set to AXEL H @ "+DoubleToStr(NormalizeDouble(iMA(symbol,30,64,0,MODE_EMA, PRICE_MEDIAN,0)-870*Point,4),4));  }
J. Gundlach just mentioned that the Dollar has likely peaked – after 1200 pips rally on the Euro. At least this was a better call from him then when he suggested a triple top forming in the Dollar at 102.
Yea, I said something about the bottom too, but that was more than 2.5 months ago.
in the blog entry dated above..
You have to wonder at times how the hell these people make money at all.
In closing some notes on the commuter market.
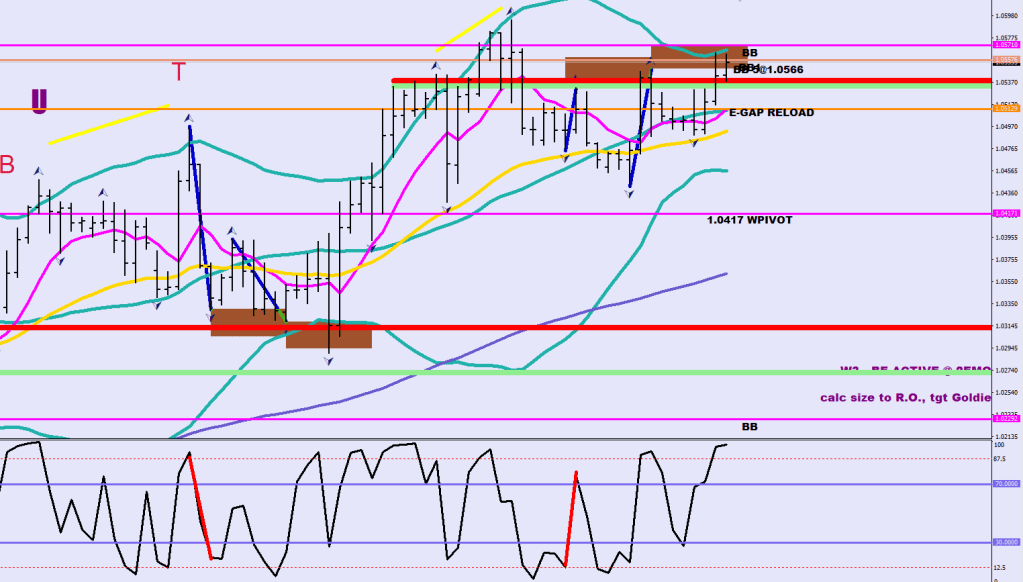
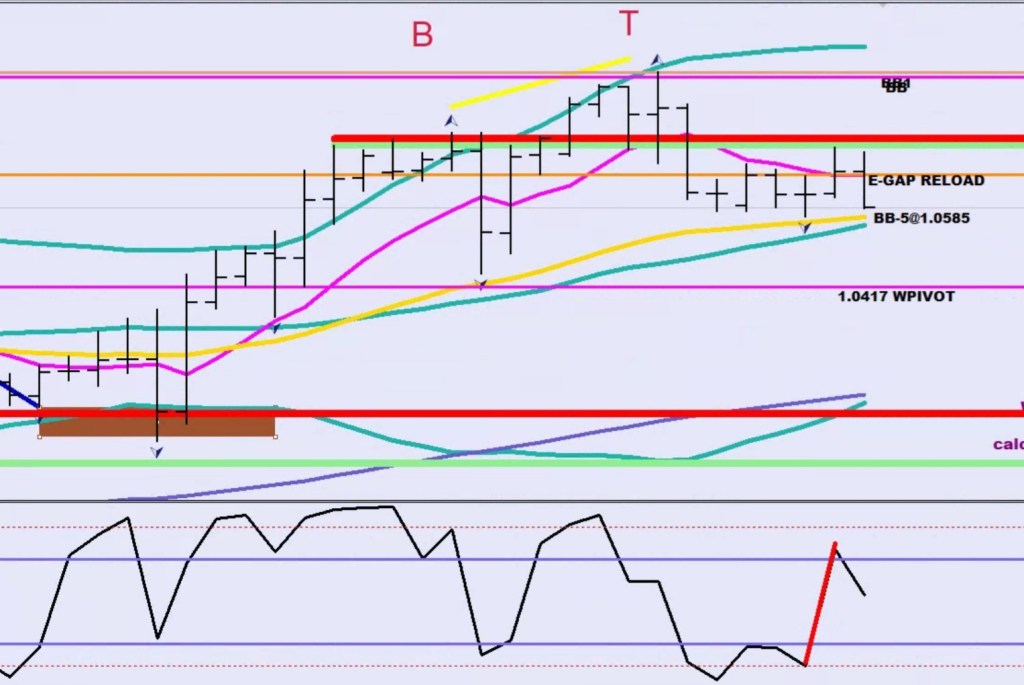
The E-67 band on the 4H seems to be a preferred reloading area (the E-89 does not get violated) to target a British Telecom on the upside.
This last buy was a front that got pushed forward – thanks to the Daily Embedding allowing for it. The extended time play was the # to !
I would think that the next move would have to come down to the band & if E-89 gets crossed over, it is over.
The rising wedge first breaks in the wrong direction.
Tie Fighter & Electric Typewriter – 70s technology both.
Tie Machine – I made it in 2022, but to be fair, I am 70s technology myself.
Dead Giveaways
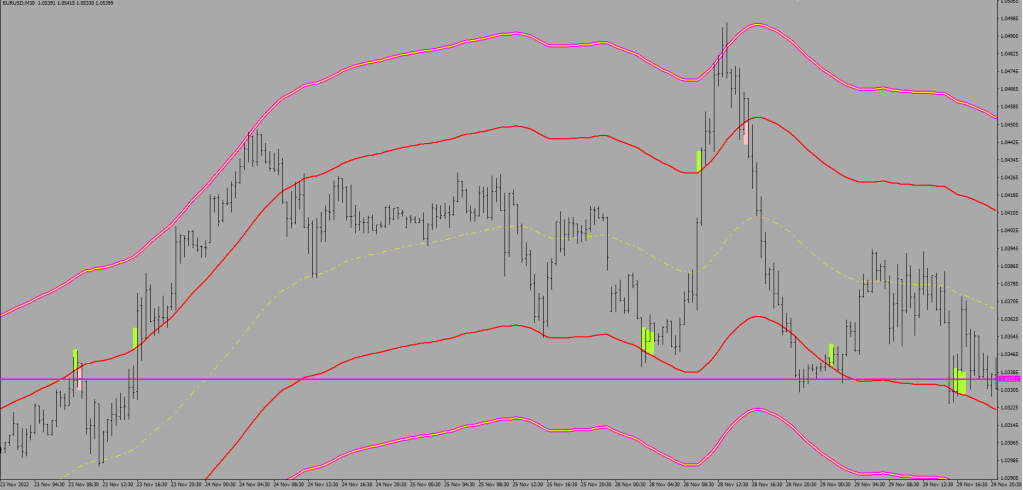
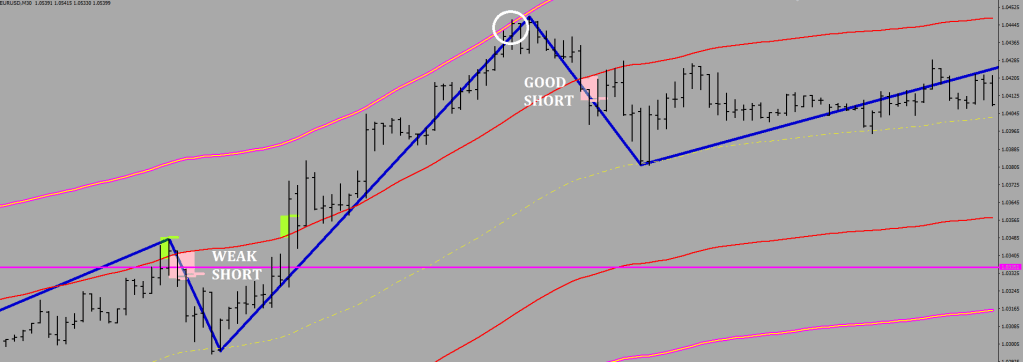
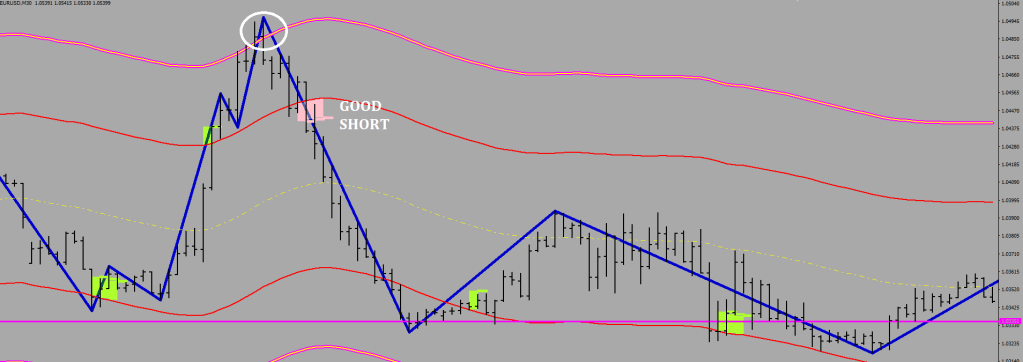
Have not settled on the pink glowing line’s name yet, but Ionosphere may be a good fit.
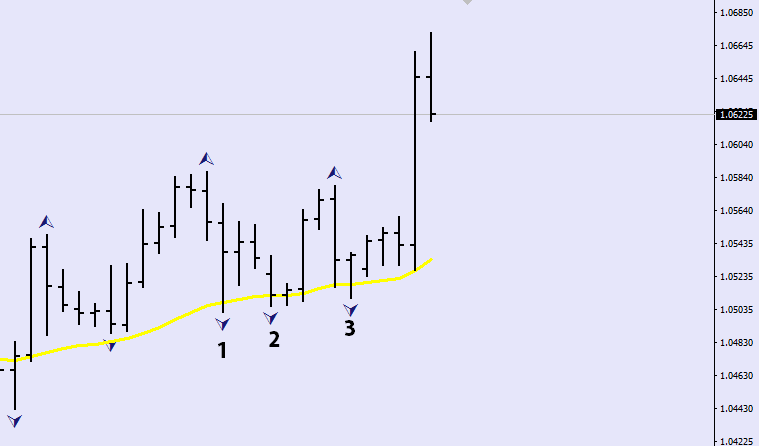
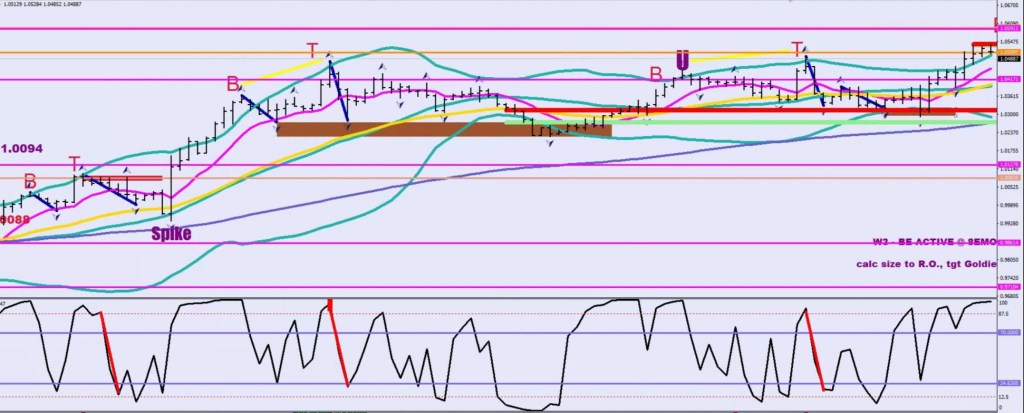
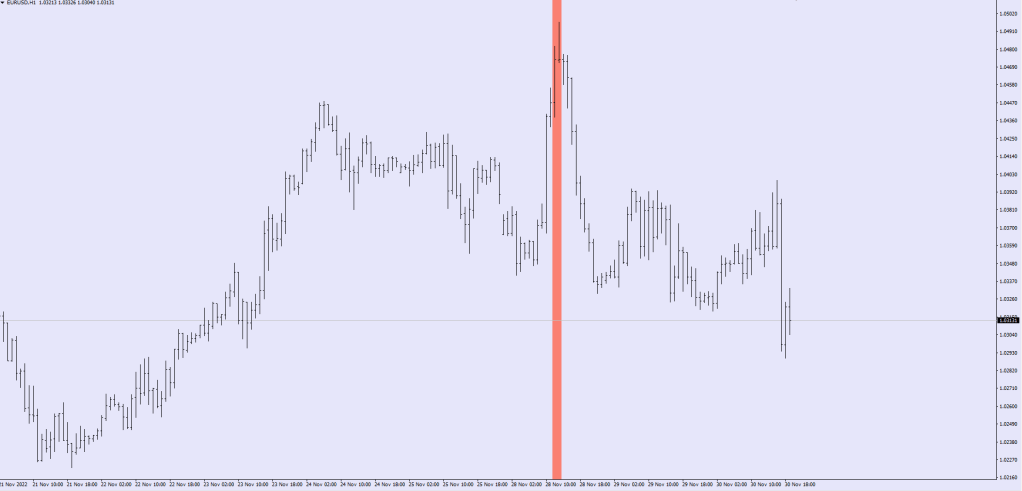
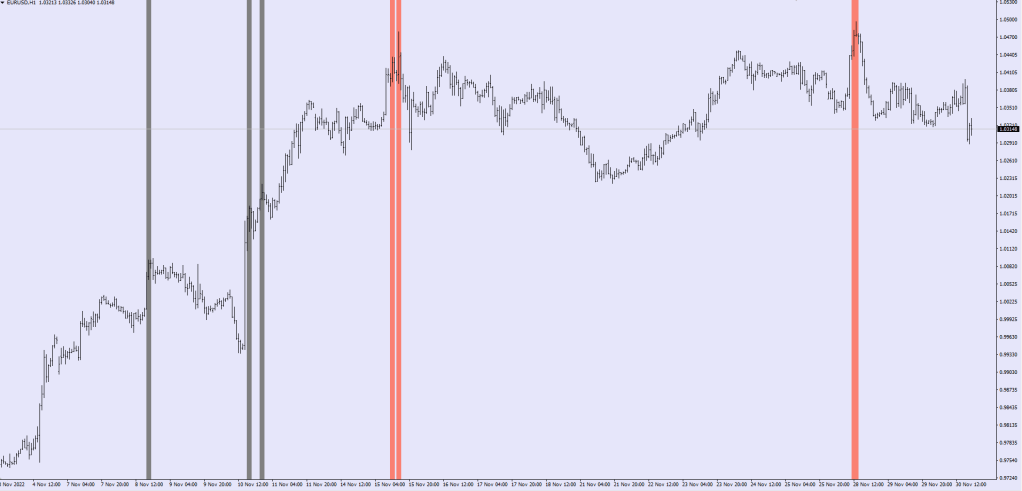
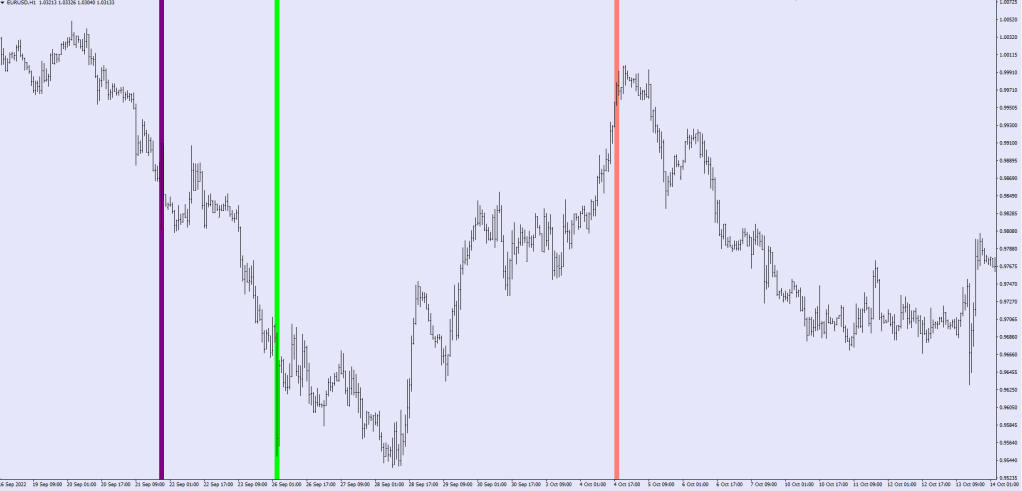
A Dead Giveaway is when the market tips its hand. A 90+ pips move in 2 hours is a Decisive Move. If from the fractal print the pullback goes too deep (i.e. 40+ pips), the move is called off. The whole thing was a trap.
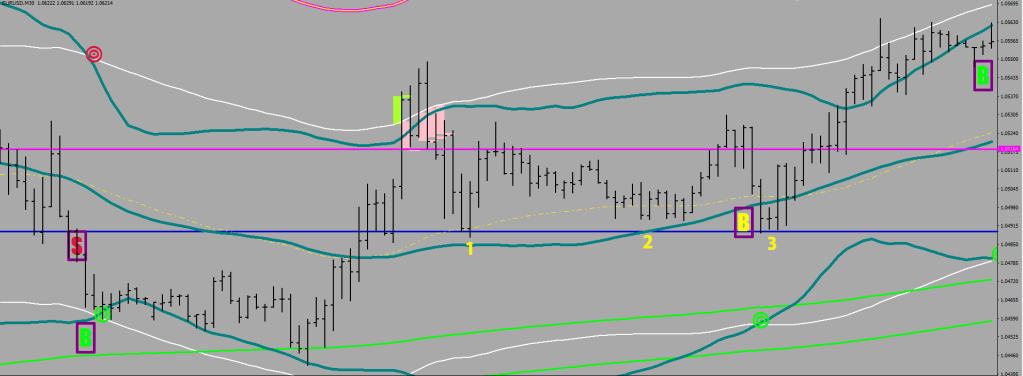
3 fractal prints at the E-32 is a soft reset. Higher high / break out guaranteed.
3 fractal prints at the E-32 is a soft reset. Higher high / break out guaranteed.
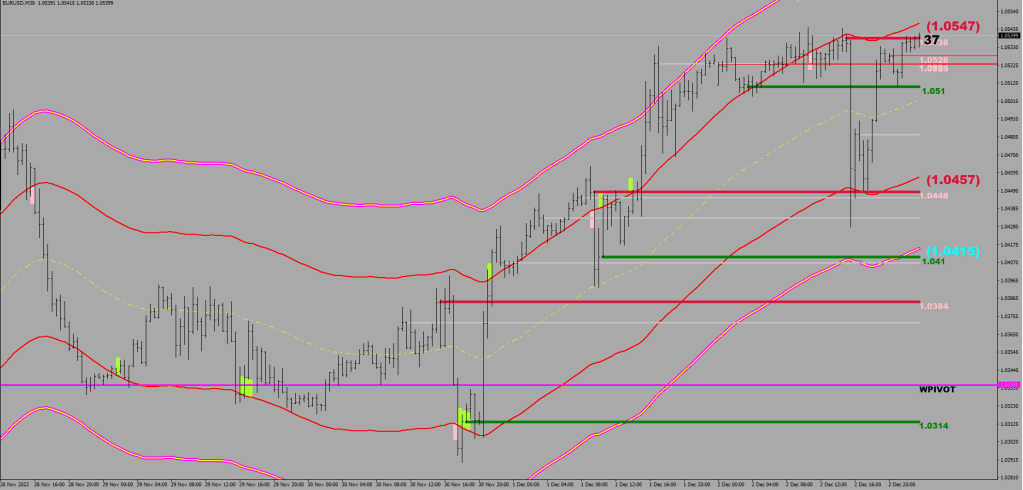
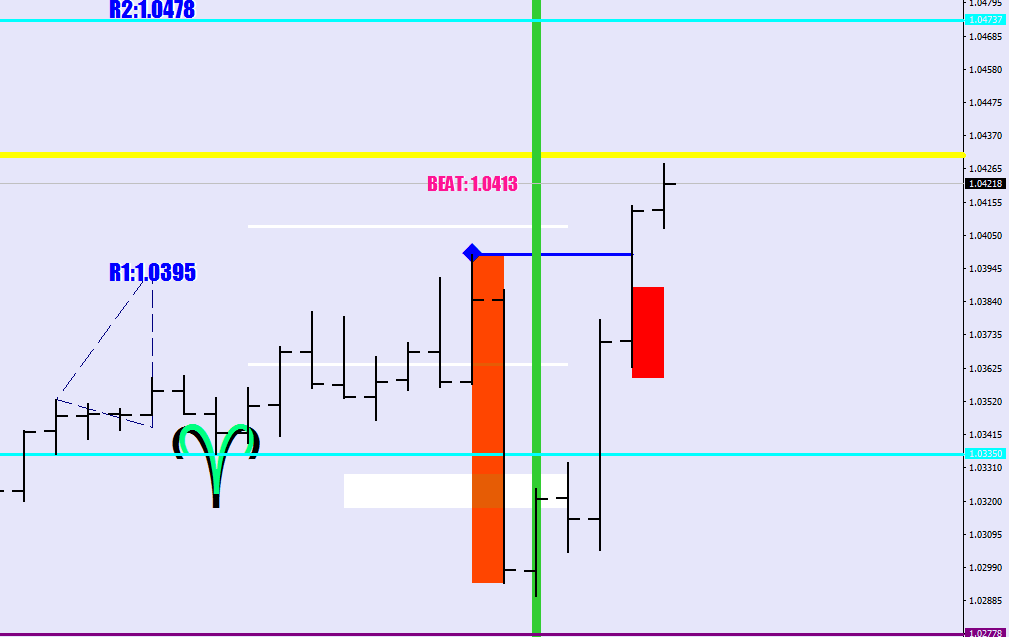
& this is the moment to acknowledge the new feature, the BUY / SELL boxes. Think about a market profile. When do you ever know if you are bouncing on a block that was a trapped net buy or net sell?
Implications & Complications
Hitting 2 Sell / Buy boxes are even better.
The Yellow Dee-Lite circles are Gender Fluid. Marks the approximate time, and turn around is pretty much the general idea.
As a famous film producer, Ridley Squat once said – or was it Diddly Scott? You know, the singer of Ivory & Savory? He had a joke about the Planet Vulcan: what do they call their dating site? Lava-Life! So much for stand up comedy ambitions. Whatever I ever do seems to have no audience.
I withdrew 10k this month – a mile stone. Wanted to buy a Samsung 85″ Q60B for £1,578, but it is no longer discounted, so I’ll just wait.
I have gotten awfully close to releasing my Kracken article, but I decided that some warming up to it may be necessary.
The rest should be thought & knife provoking.
Quick Status Quo
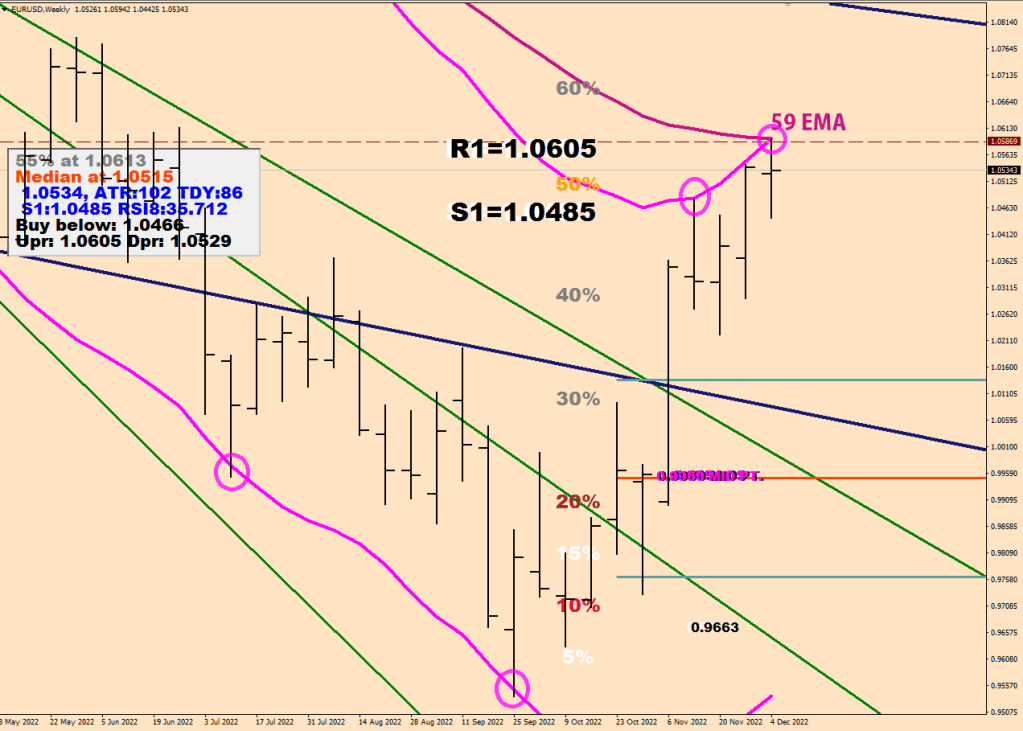
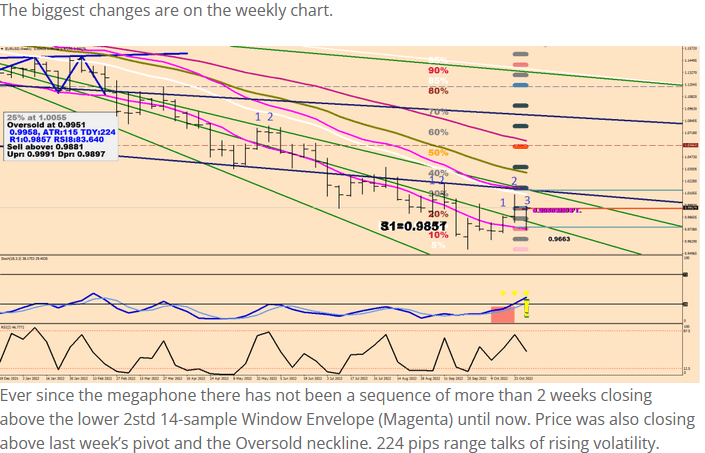
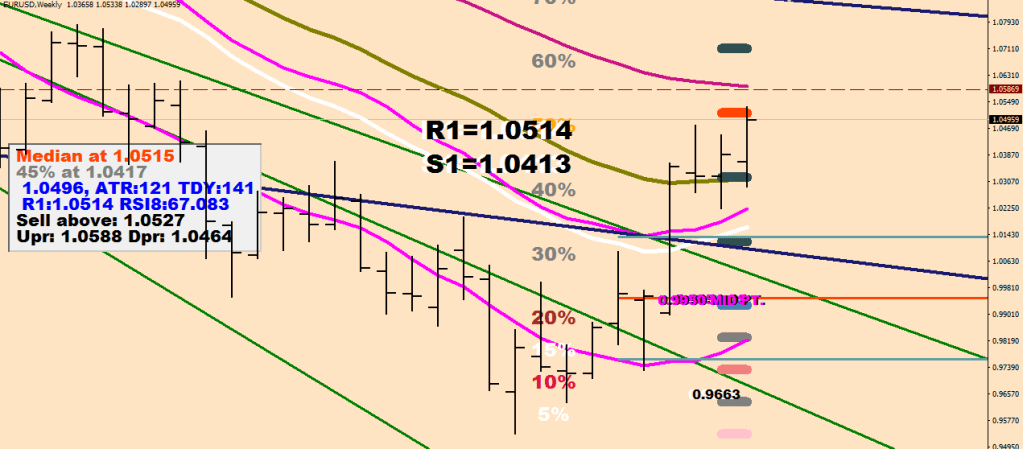
Weekly chart – how extended price is here?
The magenta lines are 5 1/4 std 14-sample window envelopes.
The 59 EMA is the ultimate limit of the Bear Market. 3 weekly closes above is the switch.
CAPtivating to see this many CAPs without price returning to the 20 SMA.
The Bitching part: From Bags to Bitchez
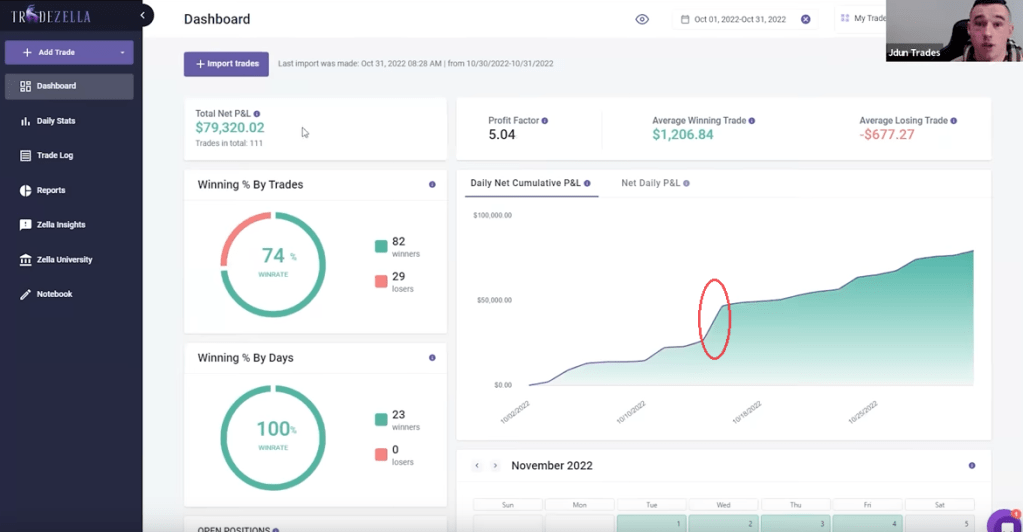
Much of the YouTube trader / statements videos are made up rubbish. Random numbers entered in a purpose made (forgery) software to grease you up to wanting to buy whatever they got for sale.
Dude, where did that 25K jump come from when your average winning trade is $1,206?
Notice the “Add Trade” – build a bear button. No “sync” to account anywhere.
Dude, what is up with that 100% win rate?
Oh yeah, we’re selling hopes and dreams here.
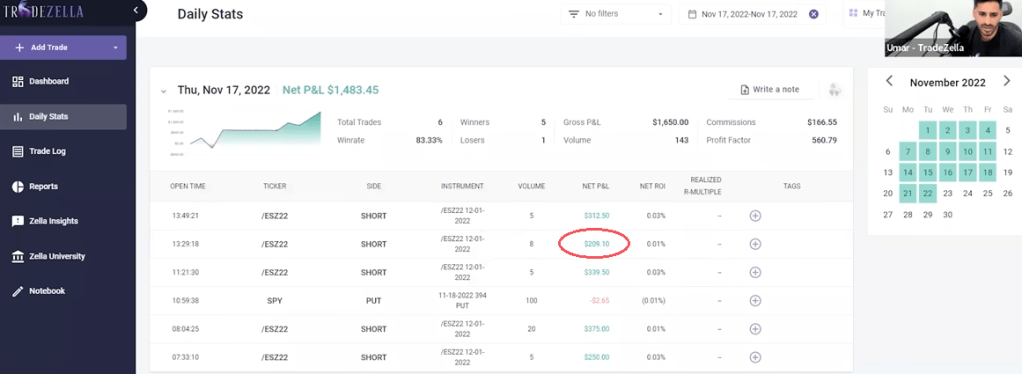
Dude, what’s up with that commission for one day?
“The numbers are all messed up” – he says in this video. No shit.
I remember still that on ES futures with a half point I was making or losing $7 and $14 on a handle per lot. Where did the 10 cents come from? (All charts shown are ThinkOrSwim).
Total random numbers. These people never traded futures in their lives.
I have warned you about people “trading” with 1-minute charts.
Not giving a link to the video, you can look up Umar Ashraf who’s making money selling stuff like the TradeZella “trading wishing on a star database maker” and posing as a trader, but he ends up winning regardless with the YouTube views.
Emini-Watch has cycle / sine waves for market timing.
DeMark counts to 9 & 13 for a pause & effect within days.
I said intraday, man. This B-52 indicator was born out of fear.
I just could not get myself to go long the Euro for weeks. I was sitting and watching 3K to 9K draw downs develop thinking all along that I would be screwing myself if I went long now.
So the idea was out there, convergence. Mark up the BB and the stratosphere converging. Filter for color based on closing outside or inside.
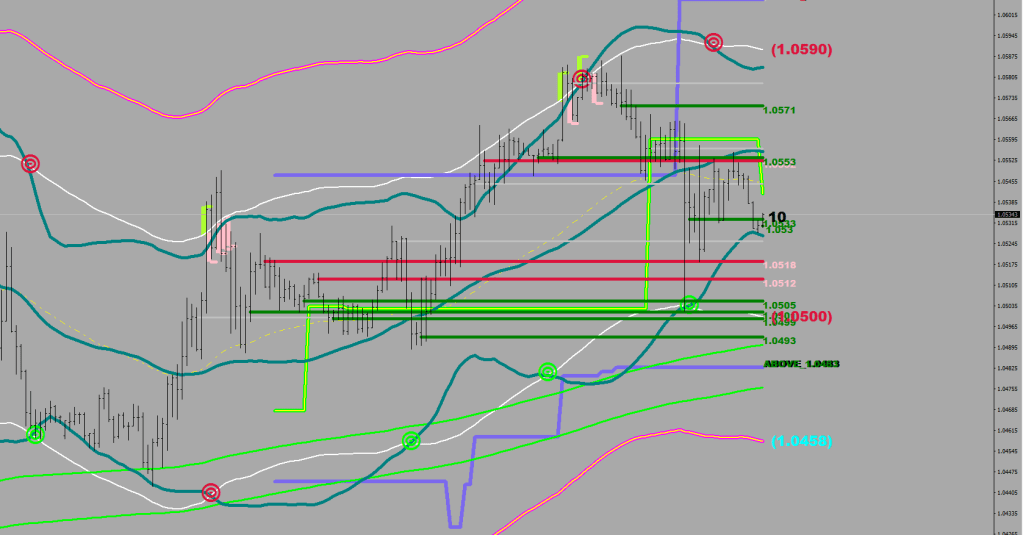
The Teal colored bands are the 60-sample 30-min HL2 Bollinger Bands.
In White we have the 30-minute 64-sample HL2 EMA displaced by + / – 45 pips.
The SlateBlue is 15-minute 9-sample swing high and low displacements at 105 pips with some consolidation mean filtering fitted onto the 30-minute chart.
The Yellow-Green combo line is the 15-min consolidation mean again fitted onto the 30-min chart.
The main ideas of this blog post is pointing out what is ultimately support / resistance: the last line out from the 3.
The interrupted Yellow is the 64-sample HL2 EMA which may serve as a soft reset turning price back to which end it came from.
This is how I made the conversion happen:

dermia[0]=termia[0];
dermia2[0]=termia2[0];
saxi[0]=taxi[0];
saxi2[0]=taxi[0];

j=1;

for (i = 1; i <=100; i++) {
  dermia[j]=termia[i*2-1];
  dermia2[j]=termia2[i*2-1];
  saxi[j]=taxi[i*2-1];
  saxi2[j]=taxi[i*2-1];
  j++;
}
The last thing is about the dirt boxes and the wave count. I see the mirror image of the previous cascading trend with the bullish wave count with each swing low dipping into the previous one’s dirt box.
The dirt box can be 50-pips deep, that does not change anything on the setup.
Wave 5 down should end up on the 2nd 4-H Fractal that prints outside the 30-sample HL2 Bollingers.
If you still have some faith in the idealistic Elliott Wave theories, abandon now or forever be entertained by this Rocky Horror Picture Show.
Wave 1 down is Wave 2 down.
3 examples from this recent run up.
Meet the Baritonos & the T.R.A. voltage.
The Baritonos Beat at the knee cap.
The TRA voltage is a power surge.
Good eye, Septic! The last TRA did not make it outside the 30-samp BB. The front row is yours.
My mistake was trying to find a Wave 2 up when all Wave 2s were printing down.
CAP means Capiche?! Wirklich!
You ain’t seen nothing yet. Behold the market trending lower with a bullish wave count.
So let’s define the final thrust.
The FT is a Wave 1 attempt in the prevailing direction. It is a clash of volatilities, it is a contract for the rights of the movie sequel. The second part / the counter move (prospect Wave 2) gives or denies the approval for drumming up enough funds. The shooting starts when the dirt box arrives with a ton of cash raised from selling Puregold sculptures.
Cure? You knew it was coming.
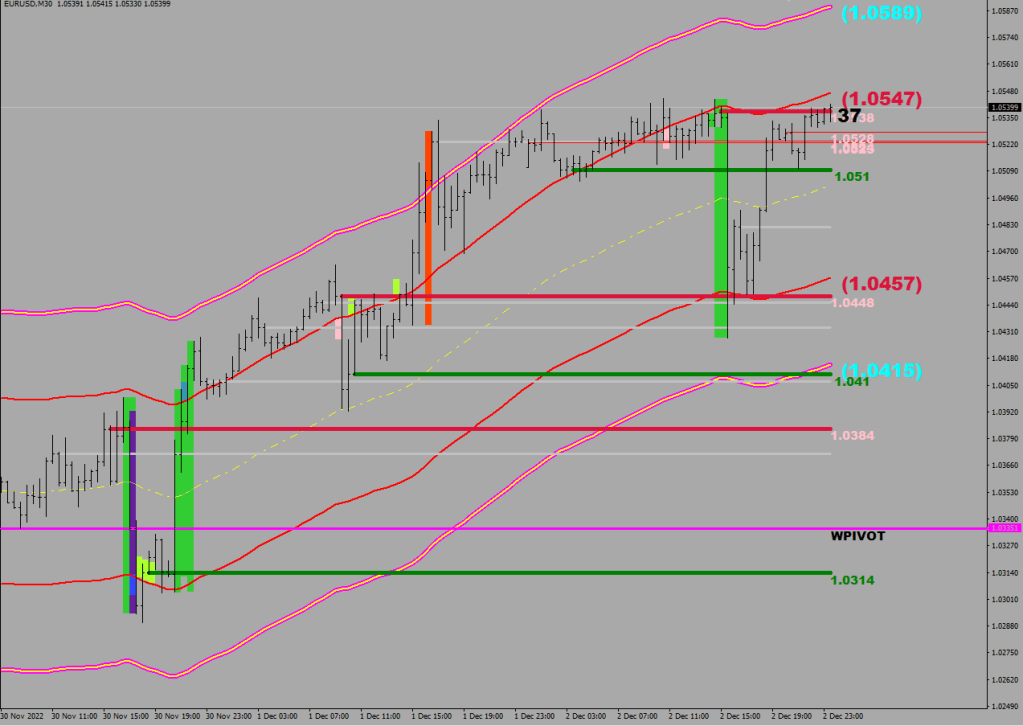
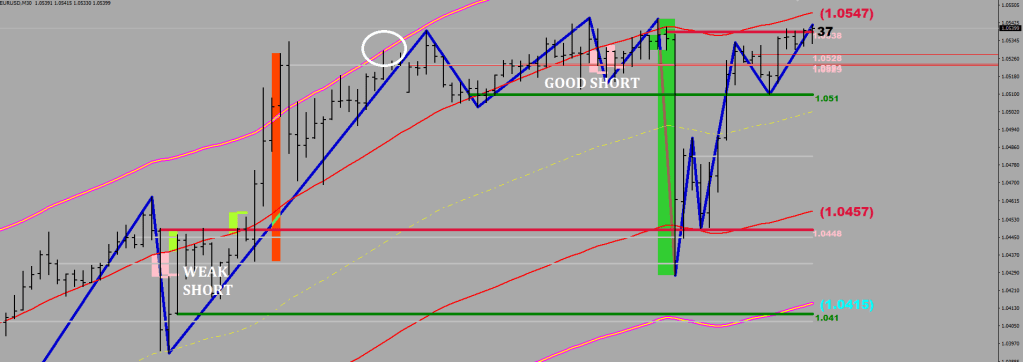
Just an interesting picture showing the buy triggers tripped whilst the sell trigger got rained on.
The way these operate is that the small wire gets tripped and up to 30-pips there’s a block for additional chunks to add. An accummulation box, yes. Nothing is guaranteed, but even the weakest signal should take price to the next Axel H line. E32 in this case.
Make it, or take it.
Santa Kraus is going to drown.
In a world, where you could be anything, don’t be a summa cum laude Pascal Programmer whom finished in 1992.
Could you spot the very first Wave 2 up since the 10th of October?
If I were a top notch trader, I would start reading what I write.
From Meet The 3000 – 04th of November>
From Commuter Market? – 13th of November>
50% target filled.
What makes the commuter market commuter? The long term commute. The train like behavior VS the pendulum like.
Notice that the market only achieves stretches on the upside (typically 4x), then returns to the mean and never gets below the lower guard rail, which is a 1x stretch.
So, better definitions first. Decisive move.
(Goldie Locks yellow for target)
I was on the verge of saying it right yesterday.
I mentioned that a Decisive move is expected to have a 35-pip kick back.
What I really should had said was, if you see a pullback greater than 35 pips, then the Decisive move is voided.
At 40 pips I should had invested in the counter move. Yesterday and today was not an opportunity to suffer a 5k draw down, but to make 8k on a hedge position.
If you know what is a must for hedging, then you know what is worth trading.
The expected kick-back on a mega candle is (160+ pips in 2 hours) is 55 pips
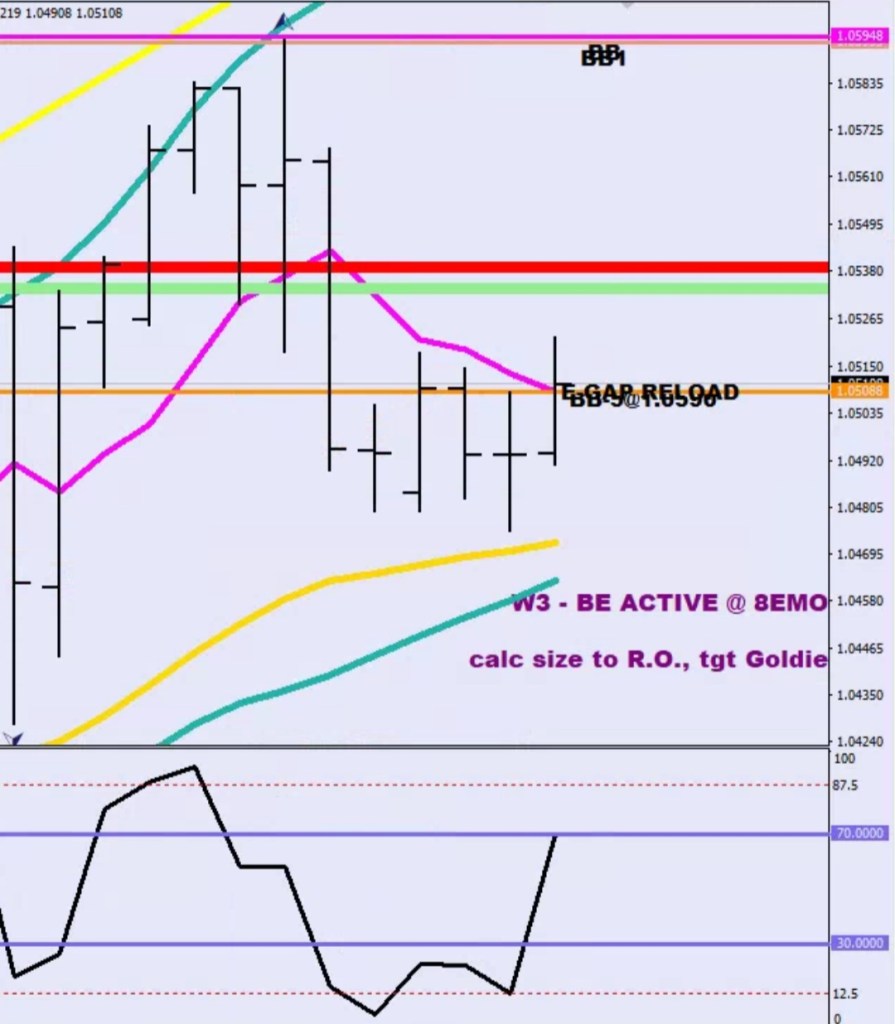
PRIMARY W1 IS AN RSI2 WEDGE – CONTRACTION W/3 HUMPS W1: FADE @ STRATOSPHERE, CH TGT, tgt E32 & S30 W2: RED TO BLUE 4H RSI2, 1.8SD ->2+SD 1H W3: NO COUNTER VOL RUN: BE ACTIVE, ADD & 8EMO, CALC SIZE FROM R.O. LEVEL W4: MEASURING LEG(V) + DIVERGENT LEG (V+) W4: RED TO BEAT OF W2 / RED TO RED W4: TARGET (NEAR MISS) W2 TERMINAL / H4-2SD-RSI / WPIVOT E4-32, TRAIL @ H4-EMO W4 HAS TYPICALLY 80-110 LENGTH A W4 CAN END UP BECOMING A 4H DRIVEN THRUST, SO ONLY START FADING AT 110 PIPS – PAY ATTENTION TO THE SQUEEZE BREAK OUT W4 DRIVEN THRUST (MAX VOLATILITY) 160-190 PIPS ANY WAVE5 CAN BECOME ESCALATED TO AN END GAME
///////////Downside Thrust

  if (Close[i]>iBands(symbol,0,30,2,0,PRICE_MEDIAN,MODE_LOWER,i)-100*Point && Low[i+2]<iBands(symbol,0,30,2,0,PRICE_MEDIAN,MODE_LOWER,i+2)-120*Point && Low[i+2]>iBands(symbol,0,30,2,0,PRICE_MEDIAN,MODE_LOWER,i+2)-960*Point && Low[i+2]<iLow(symbol,0,iLowest(symbol,0,MODE_LOW,95,i+3))
  && Close[i+4]>iBands(symbol,0,30,2,0,PRICE_MEDIAN,MODE_LOWER,i+4)-100*Point && iStochastic(symbol,0,60,3,3,MODE_SMA,0,MODE_MAIN,i+2)>2

// small decline of bands, 8EMA back 56-64 pips && daily stochastic greater than deeply oversold
 && (( (iBands(symbol,0,30,2,0,PRICE_MEDIAN,MODE_LOWER,i+14)-iBands(symbol,0,30,2,0,PRICE_MEDIAN,MODE_LOWER,i+2))<200*Point
 && iMA(symbol,0,8,0,MODE_EMA, PRICE_OPEN,i+2)+640*Point>Low[i+2]
 && iMA(symbol,0,8,0,MODE_EMA, PRICE_OPEN,i+2)-560*Point>Low[i+2]
 && iStochastic(symbol,0,60,3,3,MODE_SMA,0,MODE_MAIN,i+2)>9 && iStochastic(symbol,0,60,3,3,MODE_SMA,0,MODE_MAIN,i+2)<19)
 ||
// tight bands
 (((iBands(symbol,0,30,2,0,PRICE_MEDIAN,MODE_UPPER,i+2)-iBands(symbol,0,30,2,0,PRICE_MEDIAN,MODE_LOWER,i+2))<540*Point && Close[i+2]>iBands(symbol,0,30,2,0,PRICE_MEDIAN,MODE_LOWER,i+2)
// or oversold RSI14 and not deeply oversold stochastic (wave 3 beat)
 || (iRSI(symbol,0,14,PRICE_MEDIAN,i+2)<20 && iStochastic(symbol,0,60,3,3,MODE_SMA,0,MODE_MAIN,i+2)>10)


//or stoch coimg out of deeply oversold, above 8
|| (iStochastic(symbol,0,60,3,3,MODE_SMA,0,MODE_MAIN,i+2)>8 && iStochastic(symbol,0,60,3,3,MODE_SMA,0,MODE_MAIN,i+2)>iStochastic(symbol,0,60,3,3,MODE_SMA,0,MODE_MAIN,i+3) && iStochastic(symbol,0,60,3,3,MODE_SMA,0,MODE_MAIN,i+3)>iStochastic(symbol,0,60,3,3,MODE_SMA,0,MODE_MAIN,i+4) && Low[i+2]<iBands(symbol,0,216,2.5,0,PRICE_MEDIAN,MODE_LOWER,i+2))
)

// 8-EMA at least 19 pips above BB
 && iMA(symbol,0,8,0,MODE_EMA, PRICE_OPEN,i+2)-iBands(symbol,0,30,2,0,PRICE_MEDIAN,MODE_LOWER,i+2)>190*Point ))
There is one thing that can interfere with a U print, and that is the wave count.
The C leg of the correctice wave up was still missing.
Lots of traps were set for maximum damage.
The gap down made people cover shorts.
The break of the low made people take a loss on gapfill attemot longs. The shorts initiated at any point got killed with the violent run up to beyond the swing high. For good measure those in the know added at the 8EMO and the upper stratosphere bow backs.
This year has been brutal and it is not over yet.
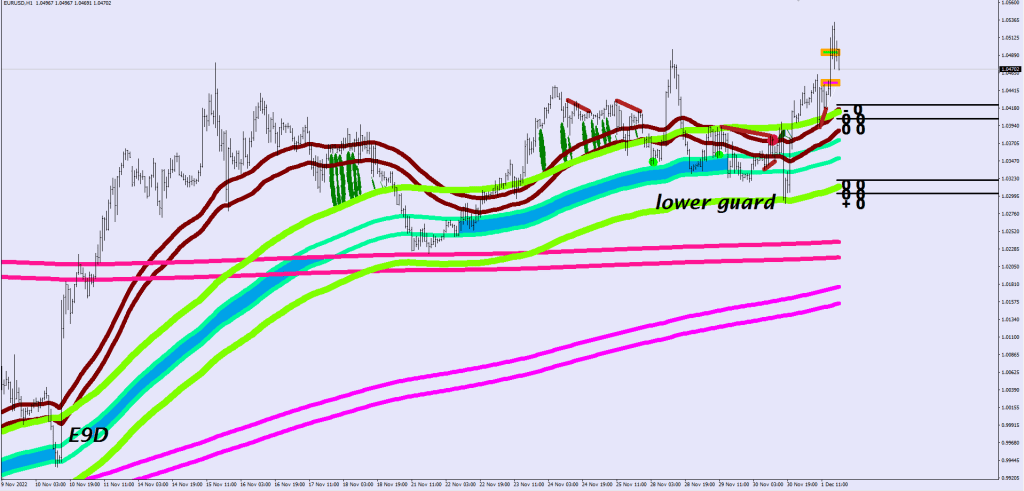
The blue trendline got its requisite re-visit and the 4x stretch from the E9D was achieved once again.
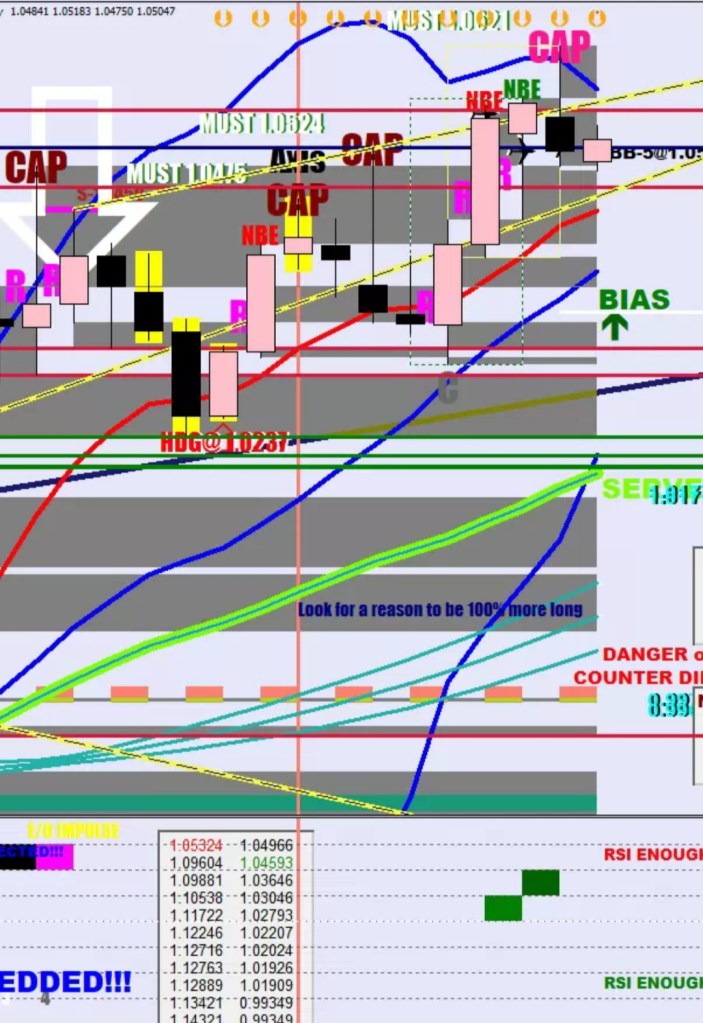
I was busy trying to spot a wave 2 up instead of paying attention to the c_ cover level of the cotrection.
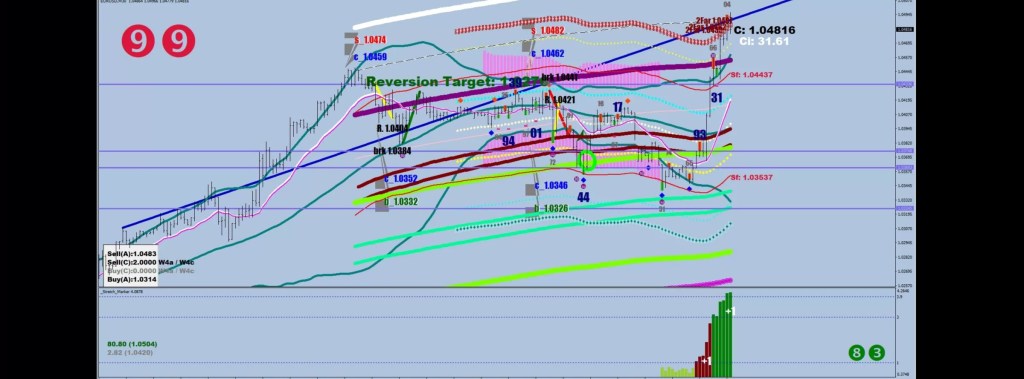
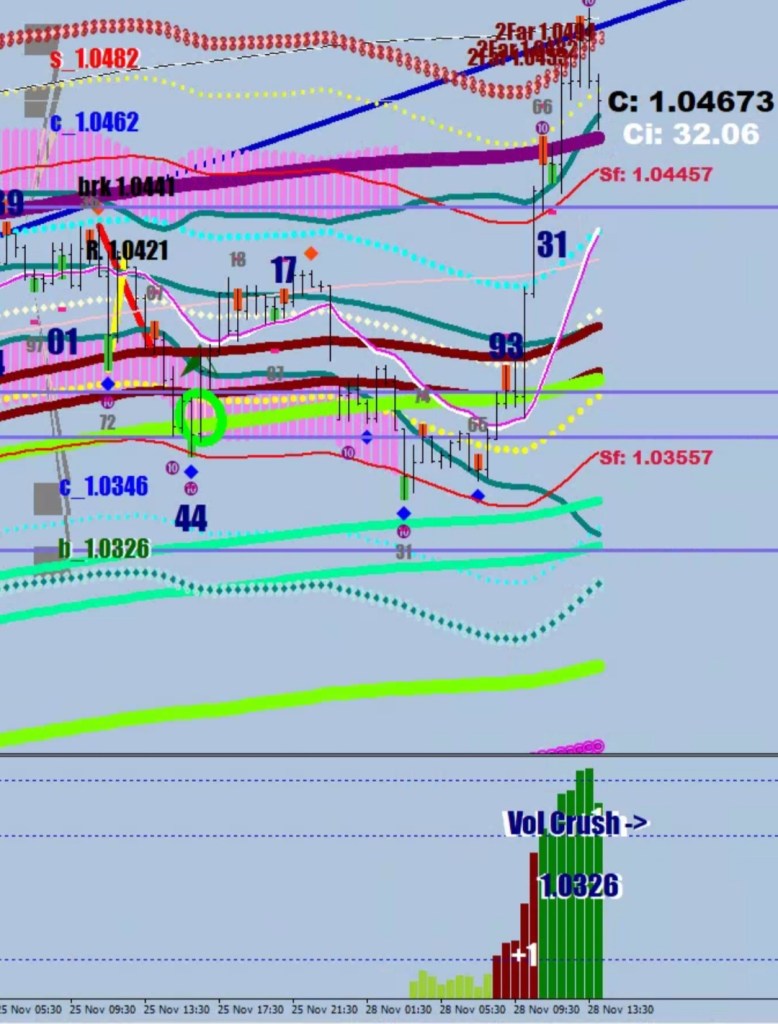
The s_ sell level was at 1.0482 – see image.
Sf = sztratoszfera, Sphinx = Szfinx
Look at how the slightest dip below the lower SF line was bought 2x
The U must arrive on cue or picture some moratorium when the print appears. 50 pips or so.
Until that Wave 2 up prints, the attrocities may not have ended.
Will insert some Pyramid images at home to add something in the title’s theme>
Projected distance of Wave A -> extension fill of Wave C































 ForexFore - Internals, indicators, algorithmic trading