Understanding The Range #3

Let’s assume that changing the market direction is a two step process.

It requires a qualified left shoulder and subsequently a head print.

I’m saying this to make you understand that although the move coming off of a left shoulder may swing out in the opposite direction as much as the left shoulder did, it does not change the status of the market and is not considered as another left shoulder now in the other direction.

In this example there were 5 days between the LS and the H.

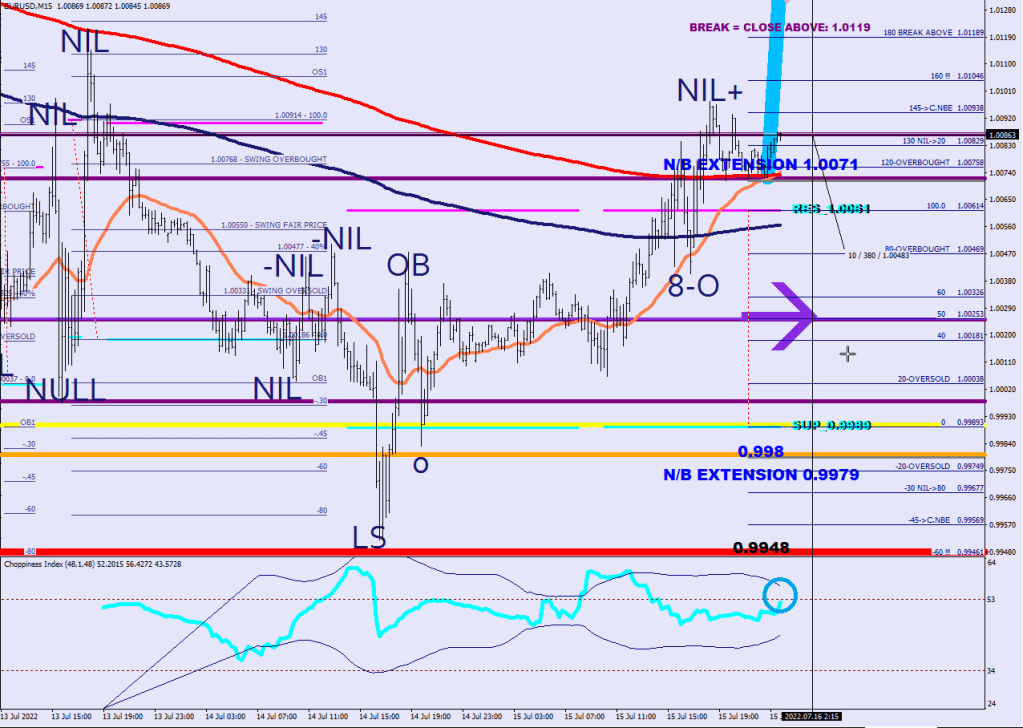
The rebound form the left shoulder I call NIL+, for it goes beyond 30%. In fact what I mean is at least by one step which puts price at 45%, perhaps somewhere even at 60-70%.

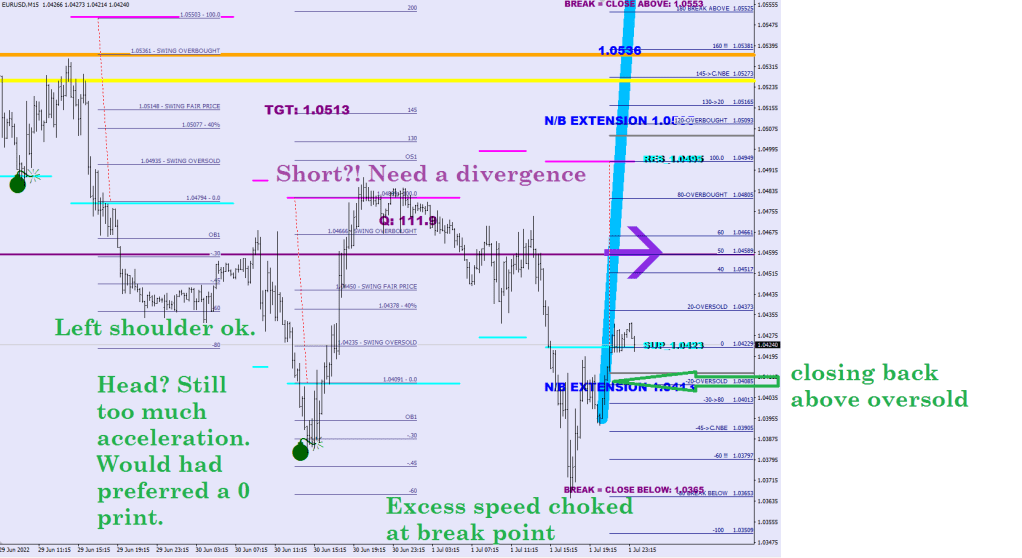
I do this as a reminder for the distance as well highlighting the outermost reading as a not to be violated by 7+ pips stop level.

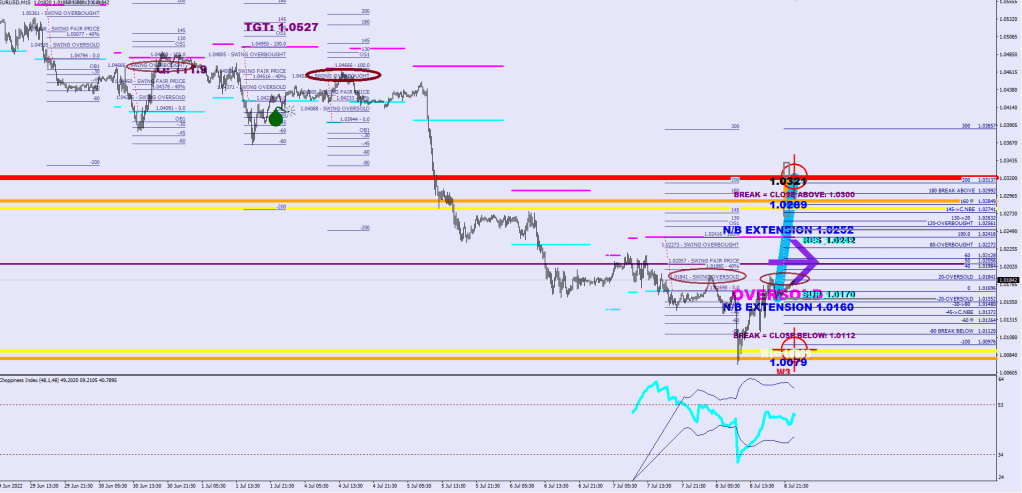
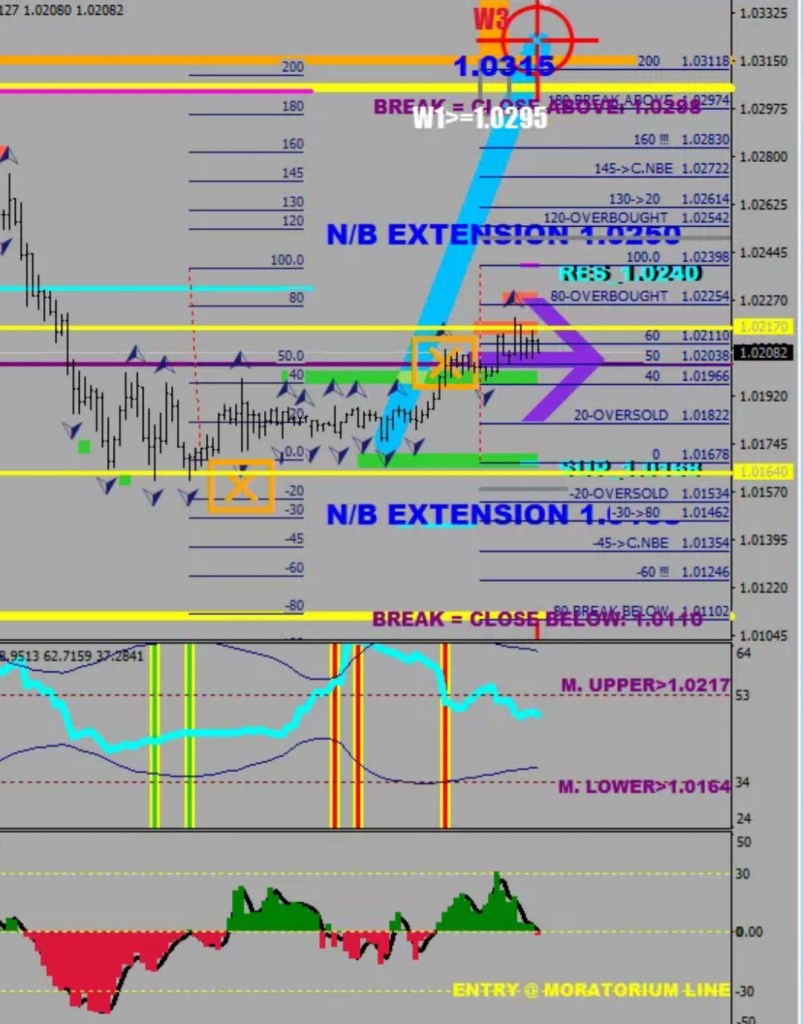
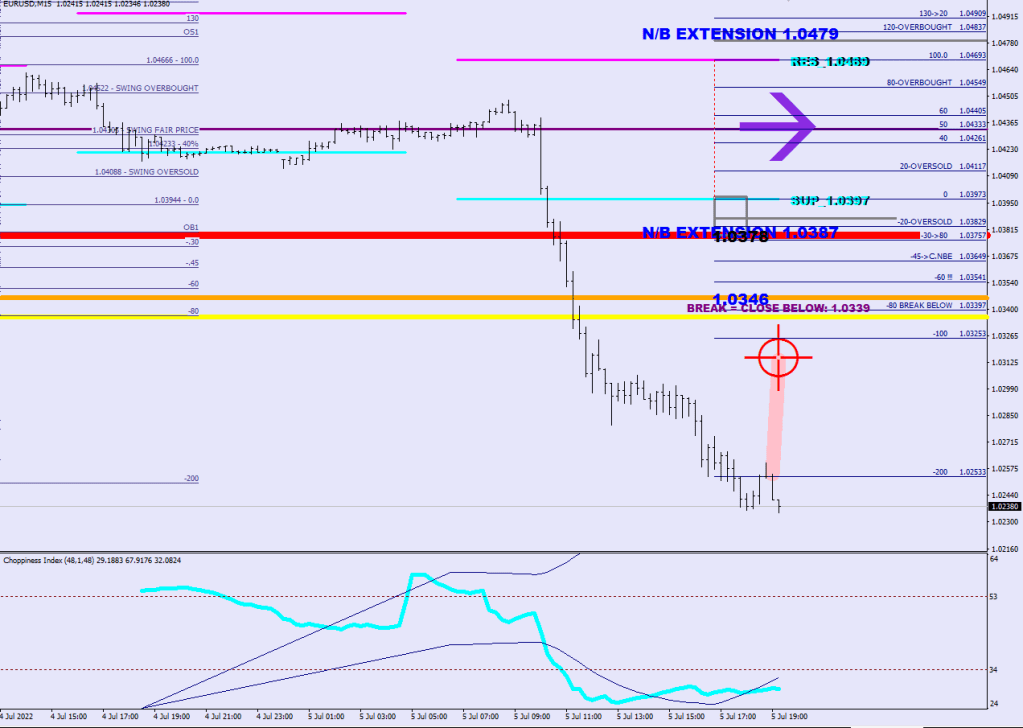
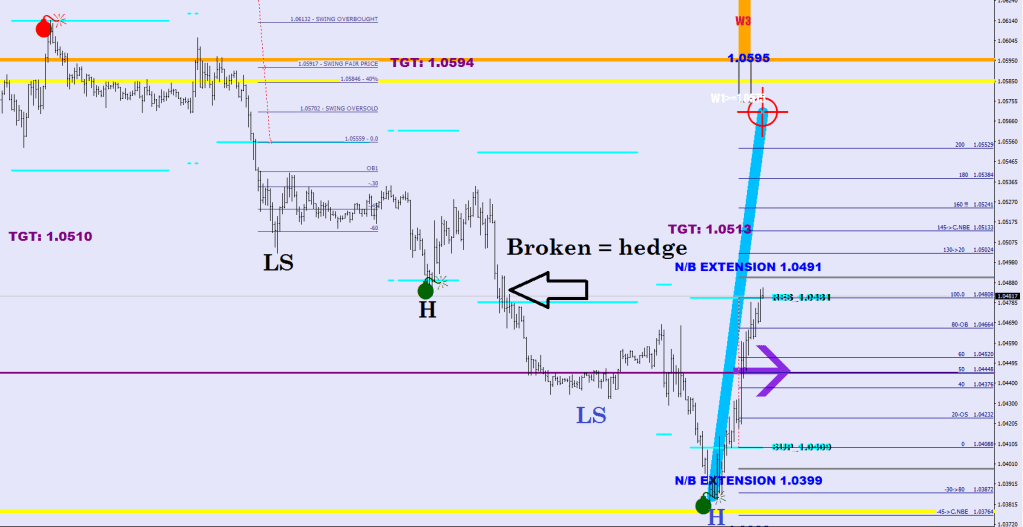
Although the left shoulder would eventually print, it should not be anticipated, only recognized. Instead when price blows through the last relevant NIL print by 10 pips your aim should be a failure at the next 200 level. I would look for the turn to take place 15 pips beyond the 200 line.

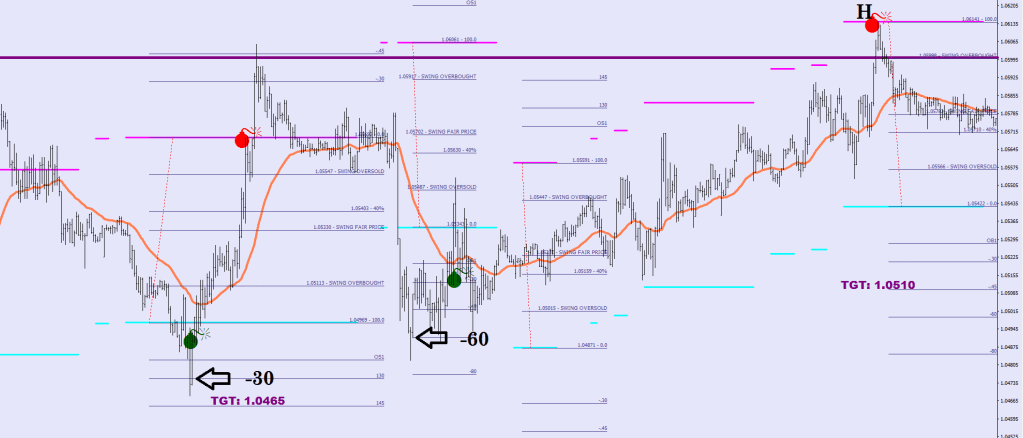
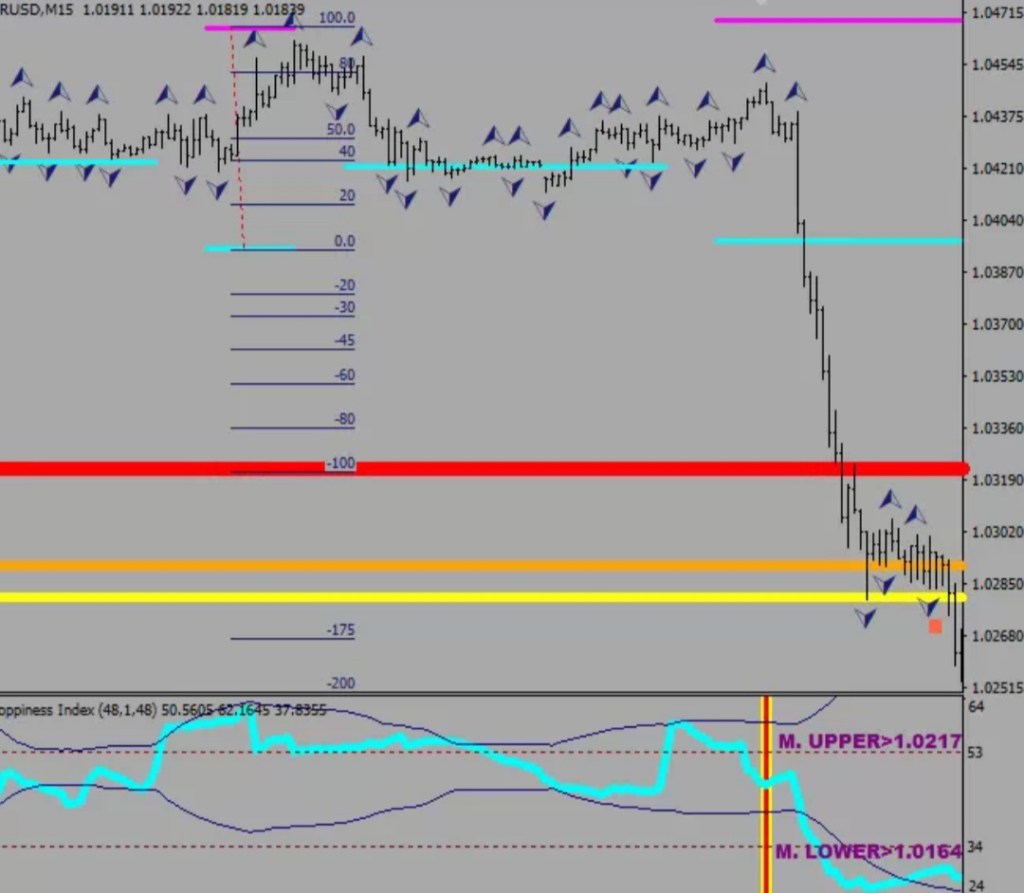
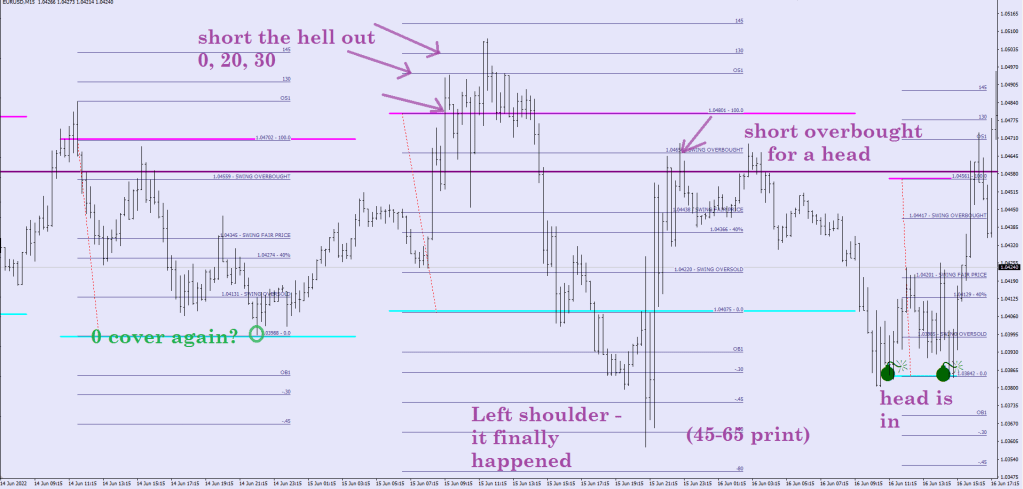
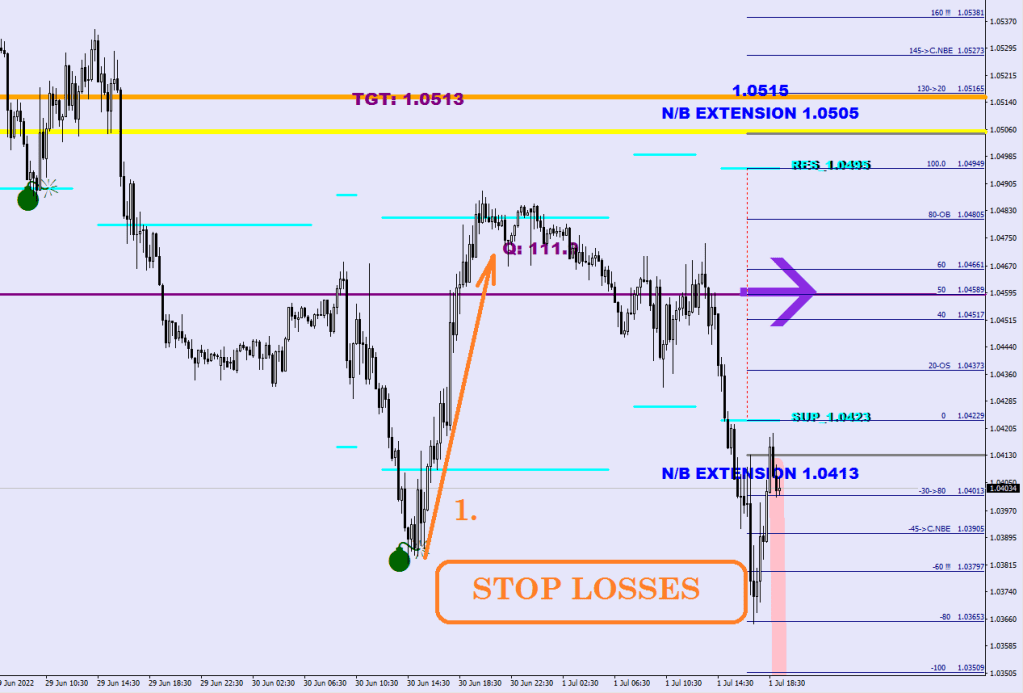
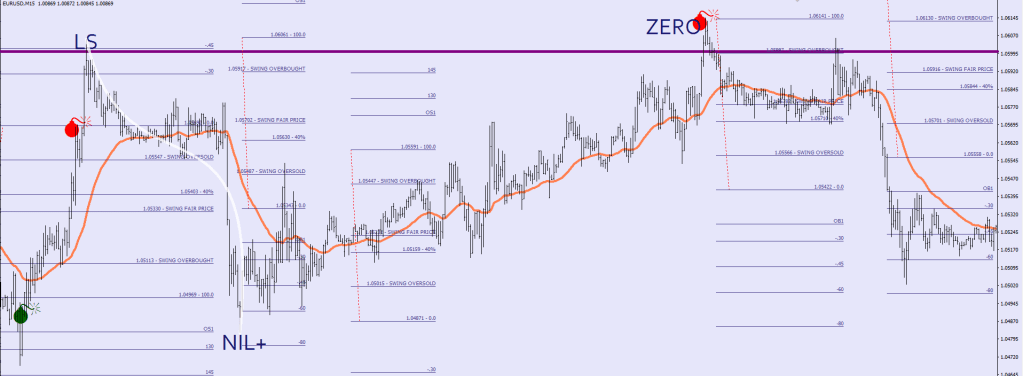
Our current example of the LS to NIL+ looks like this.

Once the NIL+ is set, the contraction in volatility should make price stay away.

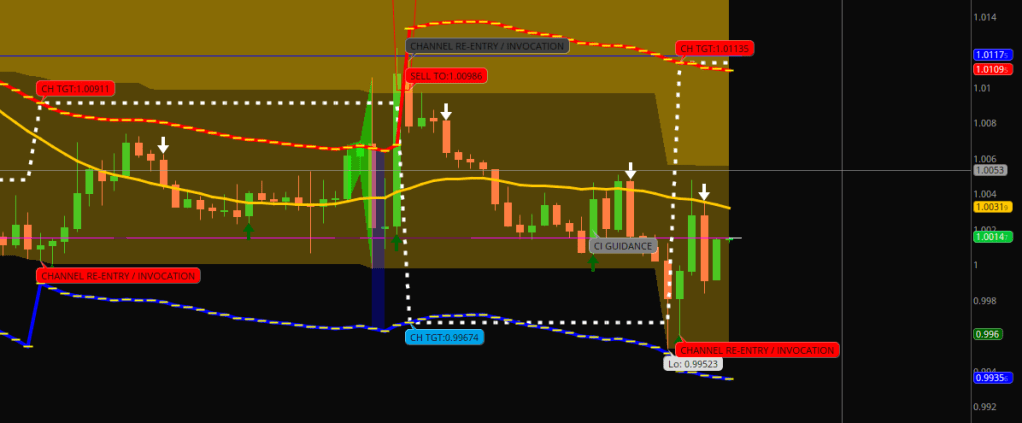
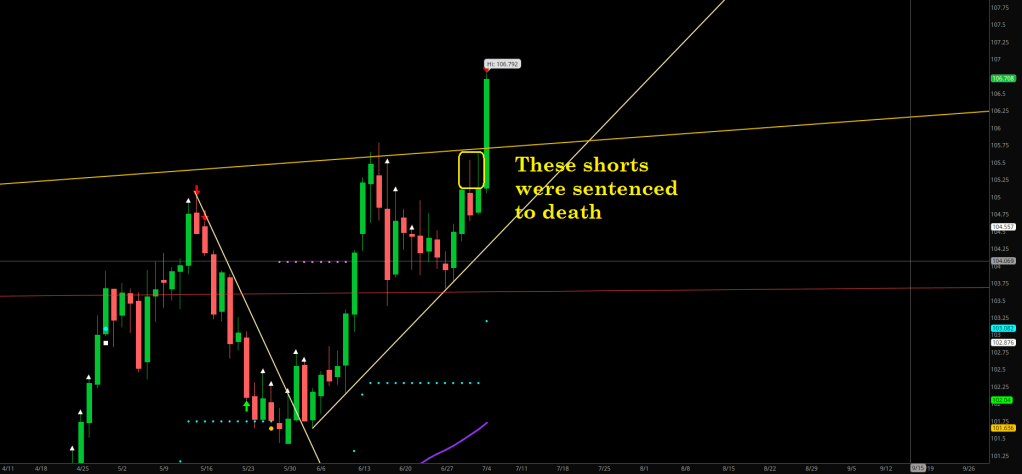
Sure, this one is a bit different, as price seems to be well on the way to a mean reversion. It all comes down to the weekly open. I showed you before how much the bears were hammering price down at this viaduct.

The Green River is the 9-day EMA (high to low). Price is trying at the lower Guard Rail for the 3rd time.

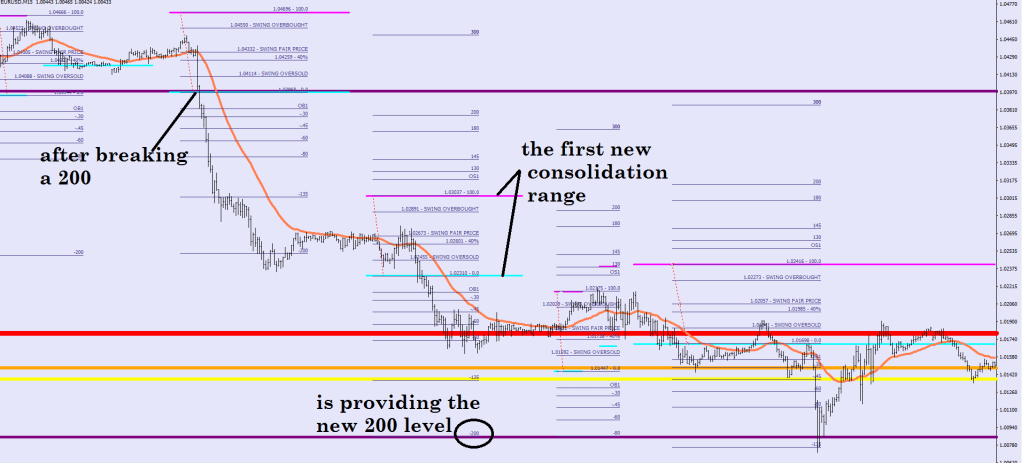
To me the logical move would be a pull back to a head – and a new range is about to be defined.

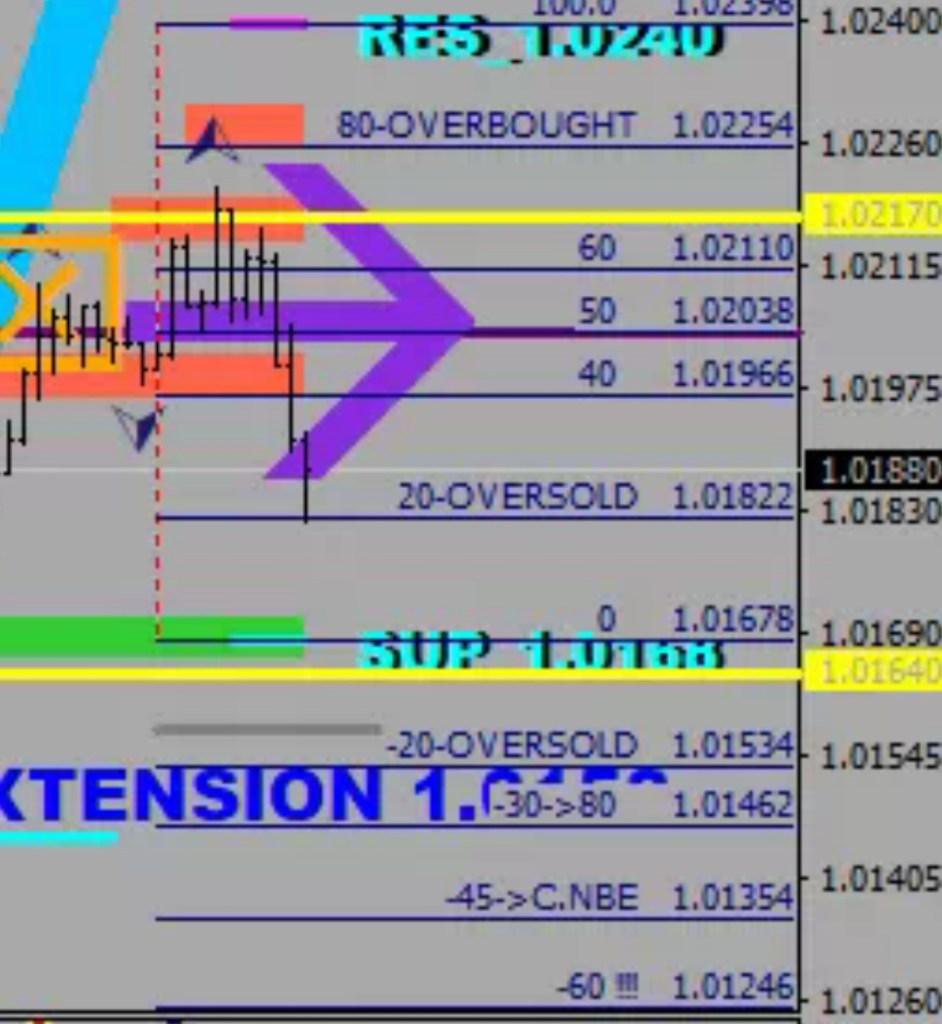
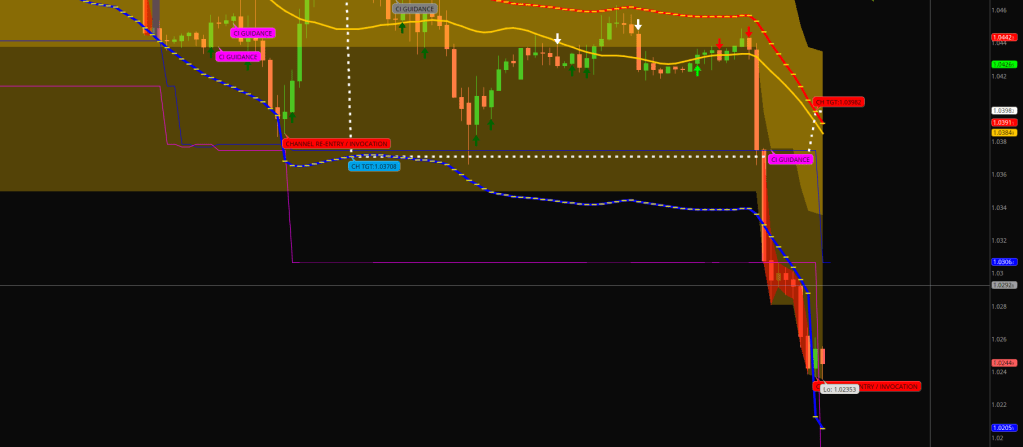
If price was to open flat, a 36+ pips move would put the new zero level about where the last overbought print was at.

-NIL is a counter-wrap around the nearer Zero Level. The EMAs are 366 (approx E89 hourly) and 484 (E-121 hourly).

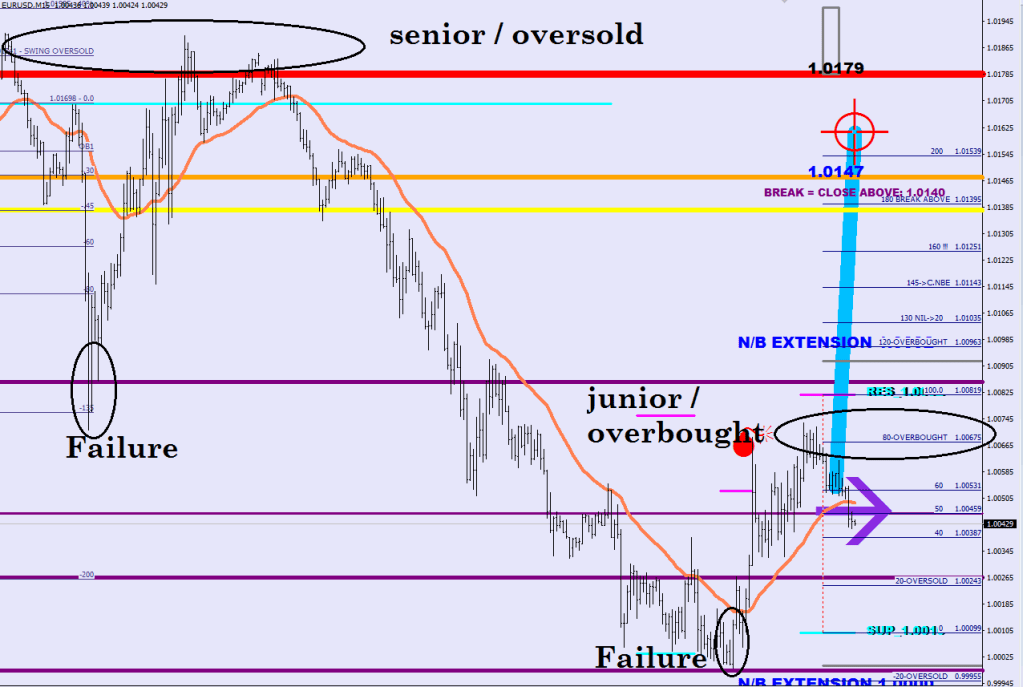
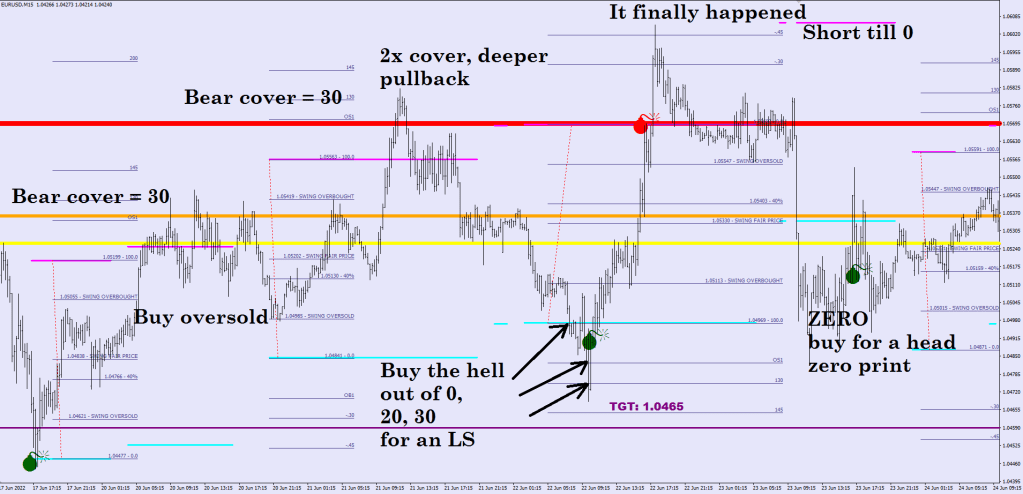
So an LS makes the market go neutral (& starts a full swing move on the pendulum), a head adds on the new direction. The Zero level to be hit is crucial, you have like 7 pips of tolerance beyond. Again, the head should not be anticipated, but once in place, the next oversold level is the perfect entry.

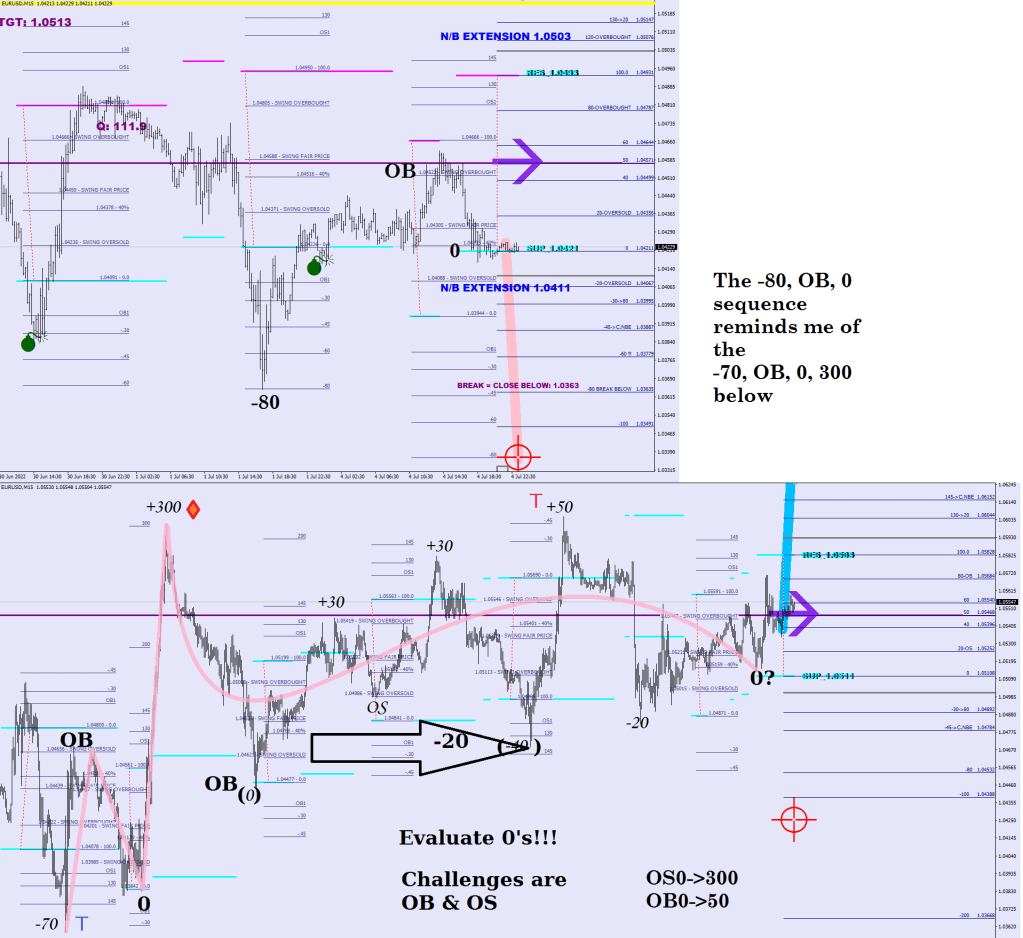
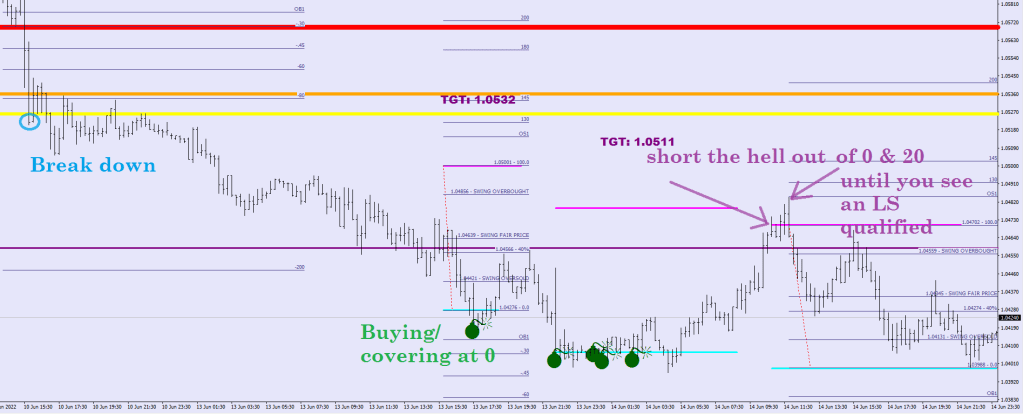
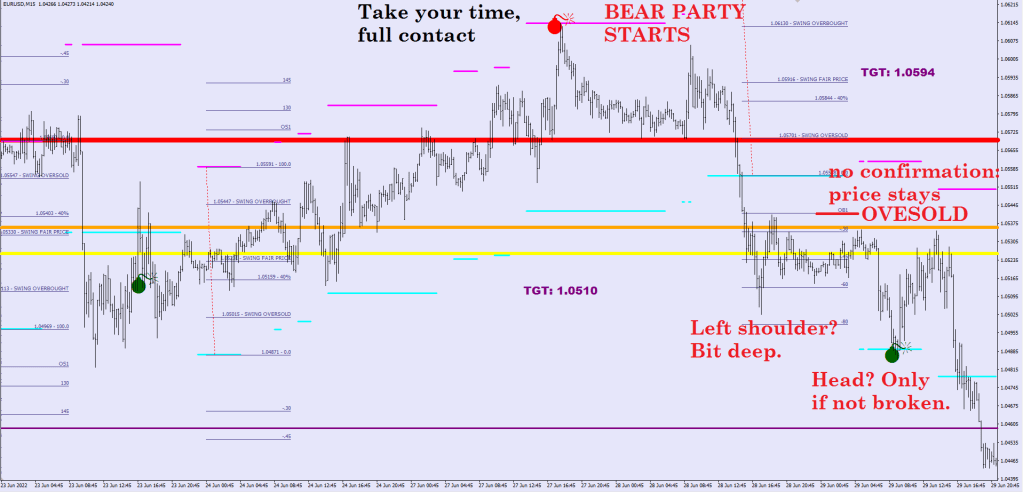
The only other example of the LS + H combo was an LS – OB – Fresh Zero (unlike currently) and from all heads you should see a move to the 200 (on the upside 300) line printed by the very same range, but speed may vary.

Understanding The Range #2

Stuff I find as I go. It’s easy to slip away.

It took forever to get the capsize right with optimal stochastic to get a change of momentum.

World Full Of Nothing.

A NIL appears in a no trend / weak trend phase. Fade up to 2 NILs in a row, but a senior zero may be used as a jumping board.
NIL to NULL

A NIL is an intention of proceeding in a direction (trying, but not immediately succeeding – i.e. hitting nothing = NihIL). The NULL (as measured by the previous range) is the counter move. A NULL is the zero level of the previous consolidation range (look left).
When the sequence of NIL->-20OS gets taken out, look for the left shoulder forming.

The Head would be a Zero of a fresh range, after which an Overbought to Oversold move would be the optimal buy entry.


If a NIL faces aggression at the nearby, senior range OB/OS level that’s a sign of intention to expand the current total range by 100.
Maximum aggression is the closer NULL.

Failure at 200 Purple line on the bottom.

Understanding The Range

For once there are a lot of videos on the subject.

Junior Range bear run short entry
80- 1.10
Senior Range (8hrs+) bear run short entry
0-30
Target -200 failure

A failure means not closing on the other side of the line for more than a full hour & volatility increasing

A conquering is 5+hours closing on the other side of the line and volatility is on the decline (contraction)

A failure bounces back to the last OB/OS level. A failure is not a reversal, but it warrants attention in case they buy the next, newly printing opposite zero.

An example of failing a 200 (back to afore mentioned time sorted sell levels).

A failure does not change the overall direction, it is a mere bounce.

Another example of conquering

An example for why using the range is better than Fifonacci or Farket Frofile.

During the last bull run in the bear even the bulls were the bears. After every leg up they covered 20-30 percent later.

Understand me.
Trying to Capsize hard, but stoch is still a tad higher than it would be desired to flip the momentum. Perhaps a close a little lower…
The sequence

Hedging With The Man

I’m gonna make it strange, for once in my life.

I’m flirting hedging with the Man in the Mirror.

You can try it at home, but do not bother with IC Markets, for they would suspend your account using the bandwidth for placing and deleting pending orders (hyperactivity they call it).

// Hedge 50 pips out for 1-position by Macdulio (forexfore.blog) in 2022

#include <stdlib.mqh>
extern int magic_number = 60;
extern int magic_number2 = 61;
int profits;
double Lots;
  double nakedshorts[];
  double nakedlongs[];
  
  double open_price;
  double stop_loss_price;
  double take_profit_price;
  double open_price2;
  double stop_loss_price2;
  double take_profit_price2;  
     
   double OrderOpenPrice;
 double OrderProfit;
 double orderstoploss = OrderStopLoss();
  string symbol = Symbol();  

int init() {
   return(0);
}

int deinit() {
  return(0);
}

int start() {
  double longaveragebuffer;
double shortaveragebuffer;
int order_type;
   
int i, counter;
int counted_bars=IndicatorCounted();
int longcount = 0;
int shortcount = 0;
double nlongs =0;
double nshorts= 0;
double shortopenedat;
double longopenedat;
double longsize;
double shortsize;

profits = 0;
 int hstTotal=OrdersHistoryTotal();

 counter = 0;
int overdrivecounter =0;


 for(i=OrdersTotal()-1; i>=0 ; i--)
 {   
   
   if(OrderSelect(i,SELECT_BY_POS,MODE_TRADES)==false)
        { 
           Print("Access to orders list failed with error (",GetLastError(),")");
           break;
        }
             if (OrderType() == OP_BUY && OrderMagicNumber()!=magic_number) 
             {
               nlongs = nlongs+OrderLots();
               longcount = longcount+1;
               longaveragebuffer = longaveragebuffer+(OrderOpenPrice()*OrderLots()); 
               longopenedat = NormalizeDouble(OrderOpenPrice(),5);   
               longsize = NormalizeDouble(OrderLots(),2);
             }  
               
             if (OrderType() == OP_SELL && OrderMagicNumber()!=magic_number2 )
             {
               nshorts = nshorts+OrderLots(); 
               shortcount = shortcount+1;         
               shortaveragebuffer = shortaveragebuffer+(OrderOpenPrice()*OrderLots());
               shortopenedat = NormalizeDouble(OrderOpenPrice(),5);
               shortsize = NormalizeDouble(OrderLots(),2);              
             }
                      
   }

if (shortsize!=0) Print ("shortsize:",shortsize);
if (longsize!=0) Print ("longsize:",longsize);
   
 
double  account = AccountEquity(); 
//double MaxLots = NormalizeDouble(AccountEquity()*.00265,2);    
double MaxLots = NormalizeDouble(AccountEquity()/2/1000,2);     

   double longsz;
   if (nshorts==0 && Close[0])  longsz=NormalizeDouble((MaxLots-nlongs),2);
   else longsz = NormalizeDouble((nshorts-nlongs),2);
   if (longsz>MarketInfo(symbol,MODE_MAXLOT)) longsz=MarketInfo(symbol,MODE_MAXLOT); 


  if (nlongs-nshorts<=0 && shortsize>0 && shortopenedat+500*Point>Ask)
  {
   open_price = NormalizeDouble(shortopenedat+500*Point, 5);
    stop_loss_price = NormalizeDouble(0.0,Digits);
    take_profit_price = NormalizeDouble(0,Digits);
 for (i = OrdersTotal() - 1; i >= 0; i--)

      if (OrderSelect(i, SELECT_BY_POS))
        if (OrderMagicNumber() == magic_number) {
          order_type = OrderType();
          if (order_type == ORDER_TYPE_BUY_STOP) {
            if ((NormalizeDouble(OrderOpenPrice(), Digits) != open_price) || (NormalizeDouble(OrderStopLoss(), Digits) != stop_loss_price) || (NormalizeDouble(OrderTakeProfit(), Digits) != take_profit_price)) {
              if (!OrderModify(OrderTicket(), open_price, stop_loss_price, take_profit_price, OrderExpiration()))
                Print("Error: ", ErrorDescription(_LastError));
            }
            break;
          }
          else if (order_type == ORDER_TYPE_BUY)
            break;
        }
    if (i < 0)
      if (OrderSend(symbol, OP_BUYSTOP,  shortsize, open_price, 3, stop_loss_price, take_profit_price, magic_number+" Hedge Break Of - BUY", magic_number,0) < 0)
        Print("Error: ", ErrorDescription(_LastError));
  }

 
   double shortsz;
   
  if (nlongs==0) shortsz = NormalizeDouble((MaxLots-nshorts),2);
  else shortsz = NormalizeDouble((nlongs-nshorts),2);
  if (shortsz>MarketInfo(symbol,MODE_MAXLOT)) shortsz=MarketInfo(symbol,MODE_MAXLOT);


 if (nshorts-nlongs<=0 && longsize>0 && longopenedat-500*Point<Bid)
   {
  
   open_price2 = NormalizeDouble(longopenedat-500*Point, 5);
    stop_loss_price2 = NormalizeDouble(0,Digits);
    take_profit_price2 = NormalizeDouble(0,Digits);
    for (i = OrdersTotal() - 1; i >= 0; i--)
      if (OrderSelect(i, SELECT_BY_POS))
        if (OrderMagicNumber() == magic_number2) {
          order_type = OrderType();
          if (order_type == ORDER_TYPE_SELL_STOP) {
            if ((NormalizeDouble(OrderOpenPrice(), Digits) != open_price2) || (NormalizeDouble(OrderStopLoss(), Digits) != stop_loss_price2) || (NormalizeDouble(OrderTakeProfit(), Digits) != take_profit_price2)) {
              if (!OrderModify(OrderTicket(), open_price2, stop_loss_price2, take_profit_price2, OrderExpiration()))
                Print("Error: ", ErrorDescription(_LastError));
            }
            break;
          }
          else if (order_type == ORDER_TYPE_SELL)
            break;
        }
    if (i < 0)
      if (OrderSend(symbol, OP_SELLSTOP, longsize, open_price2, 3, stop_loss_price2, take_profit_price2, magic_number2+" Hedge Break Of - SELL", magic_number2,0) < 0)
        Print("Error: ", ErrorDescription(_LastError));
  }
  
        
  return(0);
}

This is one free piece of the puzzle. The 50 pip was designed for an accurate entry, an oversold / overbought neckline relative to the current consolidation mean. In theory it should never get a fill if you can figure the direction right (where was the last qualifying head & shoulder) and if you don’t get unlucky overnight with an extra 10 pips in both direction on the bid and the ask from your broker.

I wrote the program blind (offline, over the weekend), if it does not function well, come back I’ll update it.

It was designed for one single entry, yes. What does the routine do if you open a second position? Leave it in the comments.

CI has not recharged yet for a new center to be in place.

The thinking is of course simplifying things. One single position, that is the max size that a 50-pip move against would not result in a 50% draw down. The management of the hedge is based on understanding where to exit it and capturing back some / all of that temporary loss during a counter move. Protective stop loss once in the clear is a good idea. Gotta learn when to have the automated trading button temporarily off.

Guy’s a genius.

Ok, Madis is Bringin’ it too.

Now, let’s talk about that close again. It settled on a Green C, because the stochastic went higher than the target range (buying got too eager). You could still see a green period after this with a Green Laser Beam on Monday or simply a float sideways to up, but I would surrender all upside hopes upon tagging the E-9 (Red).

The Capitulation

Momentum flips with today closing back up 27 pips and Stochastic in the reversal range.
The image for the ages. Price was staying oversold right before the final capitulation act.

This move to -135 – I buy it for a left shoulder. 135 is not all that different from 65 in the mirror, now is it?

What next?

A move to the overbought. (Good old example image below) If price does not manage to achieve a new consolidation for the rest of the day, we are talking 1.1227. From there a move to a Zero likely with a new range by then. After, a Wave 3 perhaps to +300. At least, that is my thinking for now.

…from here on an unreleased blog entry that would had been called

Music To My Fears

I was thinking about Allister Brimble the other day. What was Mr. Project X Superfrog up to these days?

I found All Good Things on his YouTube as expected.

A lot of my CDs were brought over from the Philippines. On top there were a couple of Scopece CDs (Fox Hunting, Any Time). I was wondering for a minute, who even knows his name?

I did not even remember the brown Color Theory T-shirt that was in the laundry. Must had come with the first purchase of 7 or so CDs from Brian Hazard. How is your Napster Ponytail hanging on Huntington Beach, buddy?

Last Second To Midnight

By now I shared finding the consolidation mean, my percentage tool w/ labels and some of the things that seemed recurring as well as the static range made up of just shy of 2x fluctuation maximums from the 50 line.

You may be tired of this image, but oh, it managed to capture so much.

300 was followed by a 0 print at the other end.

The recent -100 went for the opposite 0: +100.

Price went below the cyan 0 line by almost 100, amd the zero (hard to see as it is covered out by the yellow money flow displacement) was a magenta line in ecistence briefly – imagine it opposite the interrupted cyan line.

Conclusion: 0 seeks 0.

Next up -30 on a future range, then equate at out of oversold and sell more at overbought (80) until a felft shoulder print (45-70%) before the last move down settling on a 0.

If the head itself overshoots the 0 by 20%, sell the next 0 again (100) for a divergent lower low.

Either this move mentioned above or the 0 after the LS would be the revolving door.

I should also mention that the -80 print earlier did not qualify for an LS as it was more than 70.

One more lesson: when the downside move overshot -200, price did not manage the +100, only got to 90 (deeply overbought).

The future is bright right before the last toll.

Price just bounced off the oversold. Should continue to at least -30, perhaps beyond -45 (LS). A lower low regardless. Adding to shorts.

The world’s gonna blow your brain.

The 300

So this was the setup:

The -70 and the -80 are testament to the high volatility at hand.

The OB / 0 range once broken is the play.

I have come to accept that direction can be turned without the daily 18-sample Stoch going to extreme.

Now the momentum flips back down after 8 days of not being able to touch the E-44.

The difference between the bottom example and the current one was the momentum.

///fizzle out
 if (High[i+8]<E44[i+8] && High[i+7]<E44[i+7] && High[i+6]<E44[i+6] && High[i+5]<E44[i+5] && High[i+4]<E44[i+4] && High[i+3]<E44[i+3] && High[i+2]<E44[i+2] && High[i+1]<E44[i+1] && High[i]<E44[i] &&
   cap[i+8]>0 && cap[i+7]>0 && cap[i+6]>0 && cap[i+5]>0 && cap[i+4]>0 && cap[i+3]>0 && cap[i+2]>0 && cap[i+1]>0) cap[i]=-1; 

The outcome in the bottom example was +300.

Since the parenting range is counted from 0 to 100, -200 is the equivalent of +300 for distance.

We can say that they both managed to get to the “300” thanks to the volatility that was available.

The initial move – due to its velocity – made projections for itself and already filled the first one.

In terms of what should happen now, the ideas derived from the prior example are as follows:

You should see a strong counter move that would not stop until the 15-minute 48-sample CI is back above 53 – and even then it would likely go to the future opposite “Zero” line which is going to be 36 pips higher than the consolidation mean itself. Time to find some available Choppiness indicator.

From there would come the next leg down and – see the bottom of the first image again, you should see up to 4 different legs down, one or two reaching to 30% on the opposite end, one making a left shoulder by achieving 45-65% and finally the touch of the Zero on the lower end would mean the head / longer term holding buy. The next left shoulder down may take out the low being made today. Just look at the bottom half of the first image and mirror everything.

It was certainly dumb of me thinking that the trendline made by three recent daily lows was anything more than a setup.

Unrelenting hammering at the Guard Rail was not going to let price to return to the mean.

The bounce could get back up to just below 1.04

fiboobjnams

Forget that a head has to be further out than a left shoulder. We got work to do. Let’s go!

ObjectCreate("Fiba", OBJ_FIBO, 0, Time[10], NBEU[0], Time[10],NBED[0]);
            
string fiboobjnams = "Fiba";

ObjectSet(fiboobjnams, OBJPROP_FIBOLEVELS, 21);
     ObjectSet(fiboobjnams, OBJPROP_FIRSTLEVEL, 0.0);
   ObjectSetFiboDescription(fiboobjnams,0,"0     %$");
   ObjectSet(fiboobjnams, OBJPROP_FIRSTLEVEL+1, 0.20);
   ObjectSetFiboDescription(fiboobjnams,1,"20-OVERSOLD   %$");
   ObjectSet(fiboobjnams, OBJPROP_FIRSTLEVEL+2, 0.4);
   ObjectSetFiboDescription(fiboobjnams,2,"40     %$");
   ObjectSet(fiboobjnams, OBJPROP_FIRSTLEVEL+3, 0.50);
   ObjectSetFiboDescription(fiboobjnams,3,"50     %$");
   ObjectSet(fiboobjnams, OBJPROP_FIRSTLEVEL+4, 0.6);
   ObjectSetFiboDescription(fiboobjnams,4,"60     %$");
   ObjectSet(fiboobjnams, OBJPROP_FIRSTLEVEL+5, 0.8);
   ObjectSetFiboDescription(fiboobjnams,5,"80-OVERBOUGHT   %$");
   ObjectSet(fiboobjnams, OBJPROP_FIRSTLEVEL+6, 1.000);
   ObjectSetFiboDescription(fiboobjnams,6,"100.0     %$");
   ObjectSet(fiboobjnams, OBJPROP_FIRSTLEVEL+7, -0.3);
   ObjectSetFiboDescription(fiboobjnams,7,"-30->80     %$");
   ObjectSet(fiboobjnams, OBJPROP_FIRSTLEVEL+8, -0.45);
   ObjectSetFiboDescription(fiboobjnams,8,"-45->C.NBE   %$");
 
   ObjectSet(fiboobjnams, OBJPROP_FIRSTLEVEL+9, 1.3);
   ObjectSetFiboDescription(fiboobjnams,9,"130->20     %$");
   ObjectSet(fiboobjnams, OBJPROP_FIRSTLEVEL+10, 1.45);
   ObjectSetFiboDescription(fiboobjnams,10,"145->C.NBE  %$");
 
 ObjectSet(fiboobjnams, OBJPROP_FIRSTLEVEL+11, 2.0);
   ObjectSetFiboDescription(fiboobjnams,11,"200     %$");
   ObjectSet(fiboobjnams, OBJPROP_FIRSTLEVEL+12, 3.0);
   ObjectSetFiboDescription(fiboobjnams,12,"300     %$"); 
   
 
 ObjectSet(fiboobjnams, OBJPROP_FIRSTLEVEL+13, -1.0);
   ObjectSetFiboDescription(fiboobjnams,13,"-100     %$");
   ObjectSet(fiboobjnams, OBJPROP_FIRSTLEVEL+14, -2.0);
   ObjectSetFiboDescription(fiboobjnams,14,"-200     %$");   

 ObjectSet(fiboobjnams, OBJPROP_FIRSTLEVEL+15, -0.8);
   ObjectSetFiboDescription(fiboobjnams,15,"-80 BREAK BELOW   %$");
    ObjectSet(fiboobjnams, OBJPROP_FIRSTLEVEL+16, 1.80);
   ObjectSetFiboDescription(fiboobjnams,16,"180 BREAK ABOVE  %$");
   
   ObjectSet(fiboobjnams, OBJPROP_FIRSTLEVEL+17, -0.6);
   ObjectSetFiboDescription(fiboobjnams,17,"-60 !!!   %$");
    ObjectSet(fiboobjnams, OBJPROP_FIRSTLEVEL+18, 1.60);
   ObjectSetFiboDescription(fiboobjnams,18,"160 !!!   %$");
   
   
      ObjectSet(fiboobjnams, OBJPROP_FIRSTLEVEL+19, -0.2);
   ObjectSetFiboDescription(fiboobjnams,19,"-20-OVERSOLD   %$");
    ObjectSet(fiboobjnams, OBJPROP_FIRSTLEVEL+20, 1.2);
   ObjectSetFiboDescription(fiboobjnams,20,"120-OVERBOUGHT   %$");
   
   ObjectSet( "Fiba", OBJPROP_LEVELCOLOR, clrNavy) ;
   ObjectsRedraw();

It would be normal to think that a head has to qualify for a turn, but what I’m finding here is that not only the left shoulder has to precede the head, but it too has to be right and it is rather hard for it to qualify.

This is all the data I can get buffered in with 15 min / MT4.

Now we need to see a head and shoulder in reversed order on the top

No rush.

The filp.

Tezro elemento after the head print is the confirmation.
Quattro componento is inertia.
Bear Party is over for now. Time to fly.

It’s A Tarp!

Lessons of the day.

So yeah, there was that trendline, but let’s not start with that.

What happened here?

Number 1: institutions tip their hands: price moves very quickly due to high volume buying.

When large quantities are needed, they must buy on separate occasions: not to move price too far too fast, as that would be detrimental to the average cost, but also due to low liquidity: there aren’t enough contracts on offer.

So they wait for the price to fall back, they are keep on buying at market, but even that isn’t reaching the volume they had in mind. So they are going after all the pending break out orders and stop losses below the last swing low. The retail’s stop losses are gonna be within 15 pips likely.

This is not stop hunting, but a last resort of desperation to accumulate enough longs that they would get to hand back out on the way to 1.0720.

Now you can kind of picture how a lot of the 5th waves are made and why do they get 16 pips further than the last wave.

This deserves a Chuck Testa.

Perhaps even a Terra Cresta.

Slightly Mad

Woman in Chains, meningitis…

It finally happened…

I have the right metrics for spotting a left shoulder, a head, a way of anticipating the end of the divergence under development and it is time for the definitions.

A left shoulder achieves a 45%-65% gain of extra distance beyond the parenting range.

A head fails to achieve what the left shoulder had managed to do. It is unable to get away from the current patenting range to the extent that the left shoulder could, thus setting up an end of impulse wave with a reversal divergence.

If a head gets violated more than 5 hours down the road, that is a break out and needs to be played/hedged.

A head would manage at least a zero print (and nominally would get further than the left shoulder, but not relative to the current parenting range), but would fall shy from the previous distance achieved by at least 25%.

What is necessary for the head is Full Contact. I think this much I can remember.

////zero dn   
      if (iFractals(symbol,0,MODE_LOWER,i) && Low[i-1]>Low[i] && Low[i]>NBED[i]-330*Point && 
        (
         (High[i]>NBED[i] && Low[i]<NBED[i])  || (High[i+1]>NBED[i+1] && Low[i+1]<NBED[i+1]) || (High[i+2]>NBED[i+2] && Low[i+2]<NBED[i+2])
         || (High[i+3]>NBED[i+3] && Low[i+3]<NBED[i+3])  || (High[i+4]>NBED[i+4] && Low[i+4]<NBED[i+4]) 
         ) 
         &&
         (
          (Low[i+22]<NBED[i+22]-330*Point && NBED[i+22]==NBED[i+25]) || (Low[i+23]<NBED[i+23]-330*Point && NBED[i+23]==NBED[i+25])
         )
      ){
        ObjectCreate("Obellix"+IntegerToString(i), OBJ_TEXT, 0, Time[i], Low[i]+80*Point); 
     ObjectSetText("Obellix"+IntegerToString(i), CharToStr(77), 38, "Wingdings", clrDarkGreen);
      ObjectCreate("Targeted"+IntegerToString(i), OBJ_TEXT, 0, Time[i],NBEU[i]+((NBEU[i]-NBED[i])/10*4.5)+50*Point );  
                ObjectSetText("Targeted"+IntegerToString(i), "TGT: "+DoubleToStr(NormalizeDouble(NBEU[i]+((NBEU[i]-NBED[i])/10*4.5),4),4), 16, "Arial Black",  clrPurple);
   }

The move ain’t over till it’s over. Catching the head is the optimal entry. A rising/falling wedge has a sequence of a shoulder and a head.

I’m feeling slightly sad that I managed to get myself fully trapped by having no canes of knowledge, but constant uncertainties blowing at my head from a high speed fan.

Knowing where you need to hedge and until when makes a world of difference.

As for this counter trend move down was larger (230 pips) than the most recent largest (around 217 pips) this does not mean that I should be throwing away all of my ideas about the real direction.

Projected distance extension fill

No, not snail shells.

Now, who is singing songs in my head that I have never heard before?