TOS – Achilles ES Psar Cross

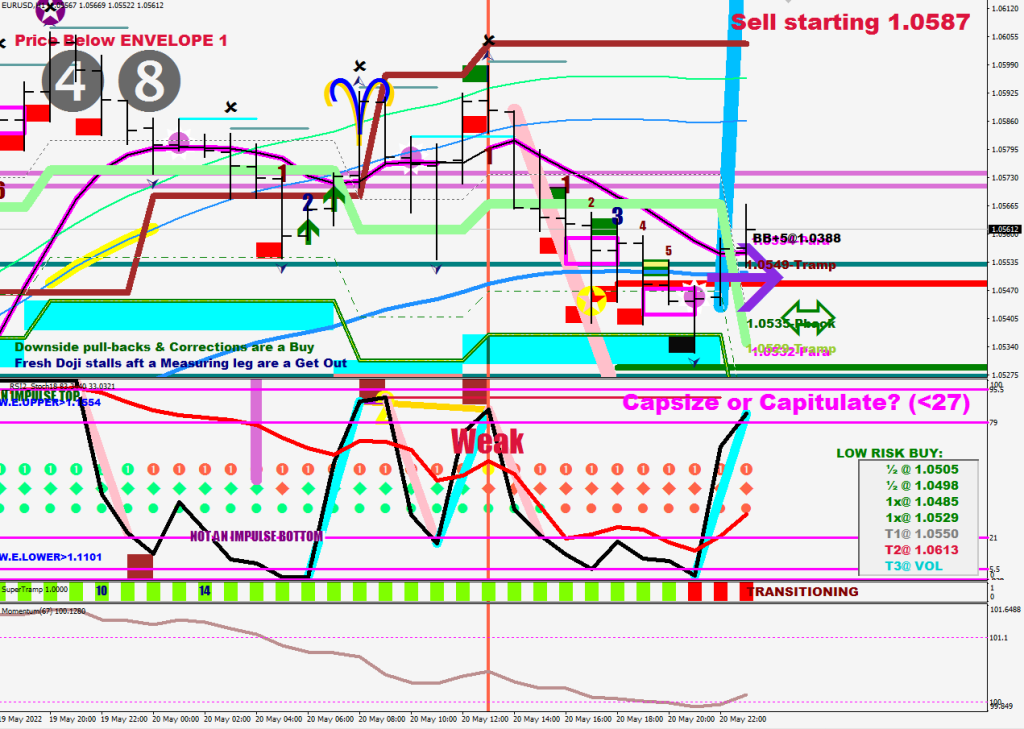
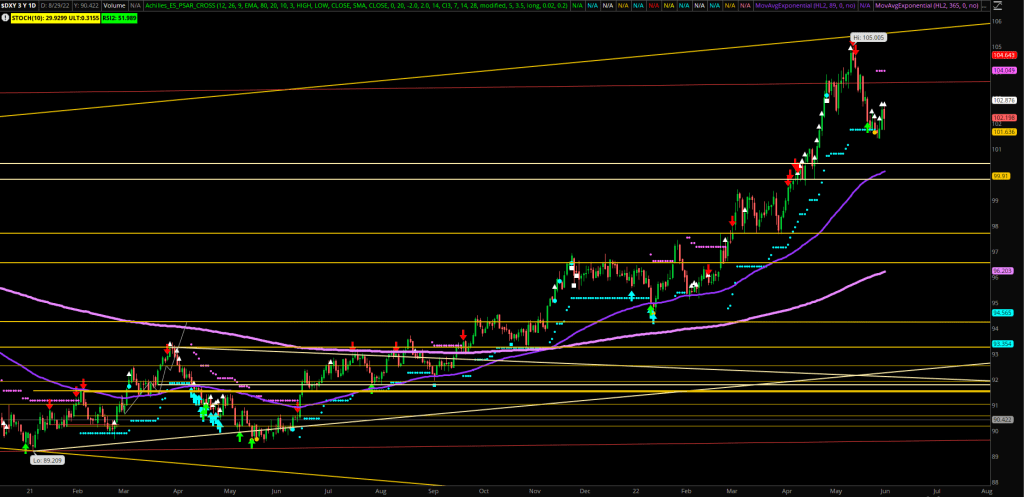
Back in time series. A program from 2011 for TOS. Originally for the ES, now for $DXY plots.

You just know that I must be running out of ideas to make desperate moves like this.

Or just giving away free stuff. In the shape of tiny, little yellow balls.

# Achilles indicator 2011 
# ver 1.007


input fastLength = 12;
input slowLength = 26;
input MACDLength = 9;
input AverageType = {SMA, default EMA};


input over_bought = 80;
input over_sold = 20;
input KPeriod = 10;
input DPeriod = 3;
input priceH = high;
input priceL = low;
input priceC = close;
input smoothingType = {default SMA, EMA};


input price = close;
input displace = 0;
input length = 20;
input Num_Dev_Dn = -2.0;
input Num_Dev_up = 2.0;

def sDev = StDev(data = price[-displace], length = length);
def MidLine = Average(data = price[-displace], length = length);
def LowerBand = MidLine + Num_Dev_Dn * sDev;
def UpperBand = MidLine + Num_Dev_up * sDev;

input Len = 14;
input CIx = {default CI3, CI2};

def CI2 = 100 * Log( Sum( TrueRange(high, close, low), Len)) / ( Highest(close[1], Len) - Lowest(close[1], Len)) / Log(Len);

def CI3 = ( ( Log(Sum(TrueRange(high, close, low), Len) / (Highest(if high >= close[1] then high else close[1], Len) - Lowest( if low <= close[1] then low else close[1], Len))) / Log(10)) / (Log(Len) / Log(10))) * 100;

def CI = if CIx == CIx.CI3 then CI3 else CI2;


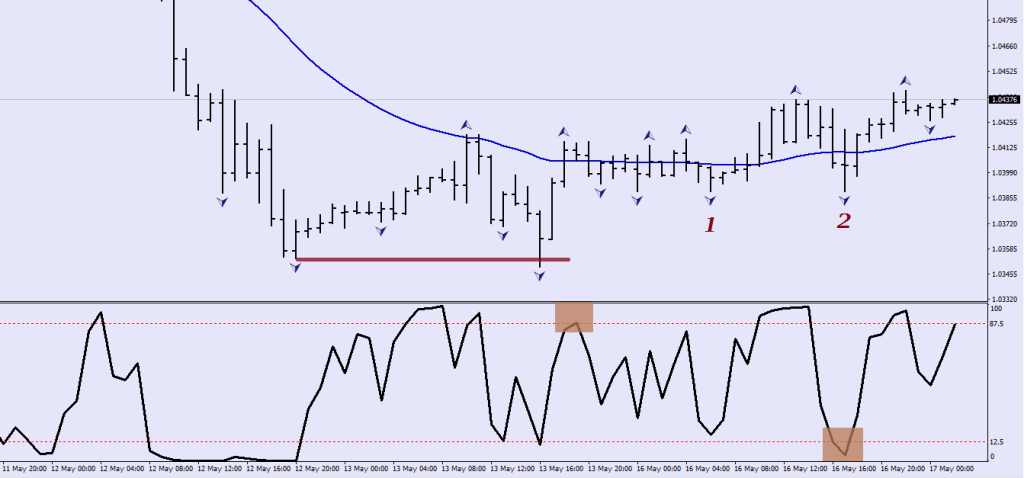
def SlowK = reference StochasticFull(over_bought, over_sold, KPeriod, DPeriod, priceH, priceL, priceC, 3, smoothingType).FullK;


def SlowD = reference StochasticFull(over_bought, over_sold, KPeriod, DPeriod, priceH, priceL, priceC, 3, smoothingType).FullD;


input fsLength = 7;
input medLength = 14;
input slLength = 28;

def trRng = TrueRange(high, close, low);

def trRngFast = Sum(trRng, fastLength);
def trRngMed = Sum(trRng, medLength);
def trRngSlow = Sum(trRng, slowLength);

def diff = close - Min(close[1], low);

def diffFast = Sum(diff, fsLength);
def diffMed = Sum(diff, medLength);
def diffSlow = Sum(diff, slLength);

def factorFast = slLength / fsLength;
def factorMed = slLength / medLength;

def valFast = (diffFast / trRngFast) * factorFast;
def valMed = (diffMed / trRngMed) * factorMed;
def valSlow = (diffSlow / trRngSlow);

def UltOsc = if trRngFast == 0 or trRngMed == 0 or trRngSlow == 0 then 0 
else (valFast + valMed + valSlow) / (factorFast + factorMed + 1);


def NetChgAvg = WildersAverage(price - price[1], 2);
def TotChgAvg = WildersAverage(AbsValue(price - price[1]), 2);
def ChgRatio = if TotChgAvg != 0 then NetChgAvg / TotChgAvg else 0;

def NetChgAvg14 = WildersAverage(price - price[1], 14);
def TotChgAvg14 = WildersAverage(AbsValue(price - price[1]), 14);
def ChgRatio14 = if TotChgAvg14 != 0 then NetChgAvg14 / TotChgAvg14 else 0;


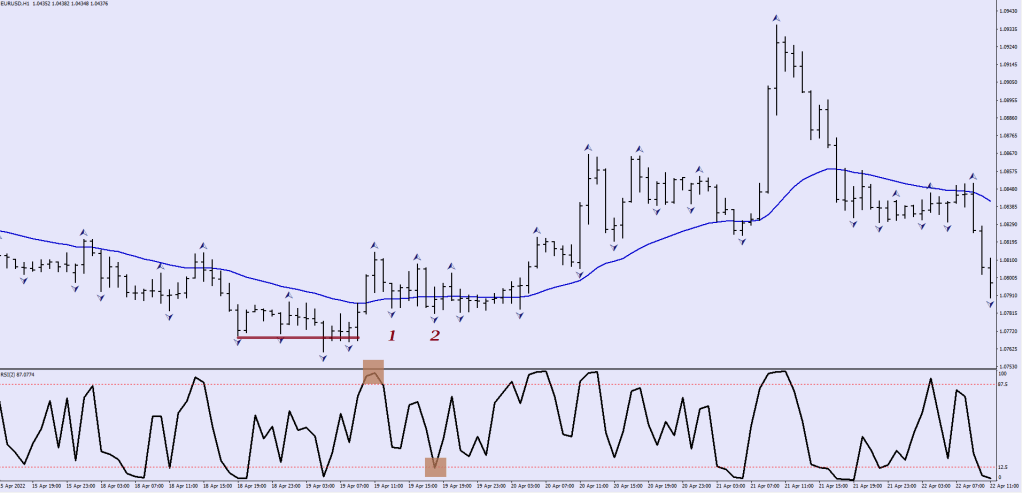
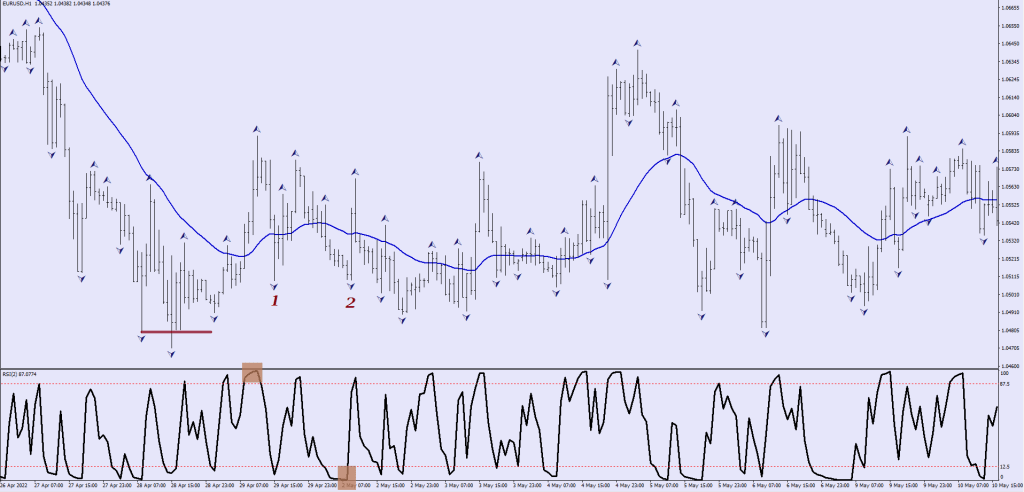
def RSi2 = (50 * (ChgRatio + 1));


def RSi = (50 * (ChgRatio14 + 1));

def condition65 = RSi >= 65 and RSi <= 75;

def condition27 = RSi <= 27 and RSi >= 15;

Alert(Crosses(RSi, 65, CrossingDirection.BELOW), "RSI 65 65 65!", Alert.BAR, Sound.Ding);
Alert(Crosses(RSi, 27, CrossingDirection.ABOVE), "RSI 27 27 27!", Alert.BAR, Sound.Ding);


def Value = MACD(fastLength, slowLength, MACDLength, AverageType).Value;
def Avg = MACD(fastLength, slowLength, MACDLength, AverageType).Avg;

def MDown = Value[1] > Avg[1] and Value < Avg;
def MUp = Value[1] < Avg[1] and Value > Avg;

def Down = ((SlowK < SlowD and SlowK > 80 and CI > 44) or ((MDown and SlowK > SlowD and SlowD > 40 and CI < 50 and CI > 35) or (MDown and SlowK > 80 and SlowD < 80))) or ((priceH > UpperBand and MUp and SlowK > 80 and CI < 48 )  or (priceH > UpperBand and SlowK > 75 and SlowD < 74 and CI > 49.40));
def Down2 = ((priceH >= UpperBand and MUp and SlowK > 90 and SlowD > 80 and CI < 48 and CI > 38 ) );
def down3 = (UltOsc >= 0.67 and SlowK >= 79);


def down6 = (CI < 27.41);


def Up =  (((SlowK > SlowD and CI < 28.01 and SlowK < 12.50) or ((SlowK  < 15.50 and CI < 35.01 ) and (SlowK > SlowD))) or (SlowK < 19 and priceL <= LowerBand and SlowD > 20 and CI > 39.25 and SlowK < SlowD)) or (MUp and SlowK < 20.18 and SlowD > SlowK and CI > 40) or (SlowK  < 12 and CI < 35.01  and SlowD < 12.50) ;

def up2 = (UltOsc <= 0.2671 and SlowK <= 21);

def up3 = (CI < 33.5);

def up4 = (UltOsc <= 0.43 and UltOsc >= 0.425) or (UltOsc <= 0.28 and UltOsc >= 0.25);

def PercentB = (price - LowerBand) / (UpperBand - LowerBand) * 100;

def up5 = (PercentB <= -22 and CI <= 24.56) or (PercentB < 0 and CI <= 34.50 and CI >= 34.20) or (PercentB < -0.9 and CI > 42 and CI < 42.80) or (PercentB <= 10 and CI > 49 and CI < 50) or (PercentB <= -1 and CI > 37.40 and CI < 37.60)  or (PercentB <= -21 and CI > 56.90 and CI < 57) or (PercentB < 24 and CI > 43.20 and CI < 43.50) or (PercentB < 5 and CI > 52.90 and CI < 53) or (PercentB < -17 and CI > 35.20 and CI < 35.50 or (PercentB < -28 and CI > 47.70 and CI < 48));

def up6 = (RSi2 <= 2);


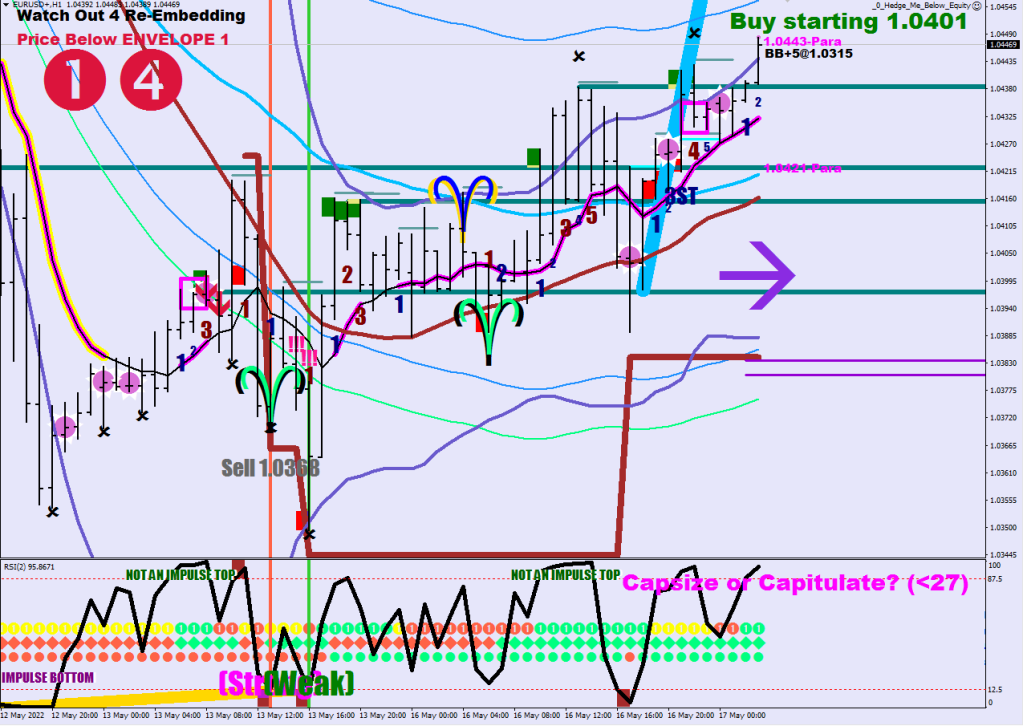
AddLabel(yes, Concat("",    
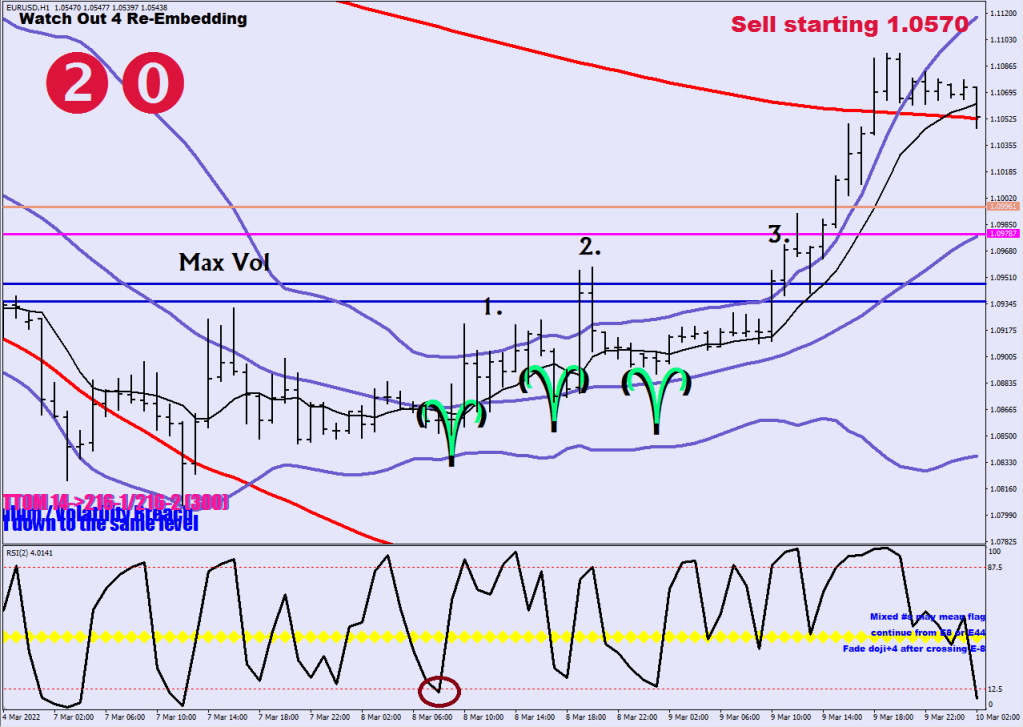
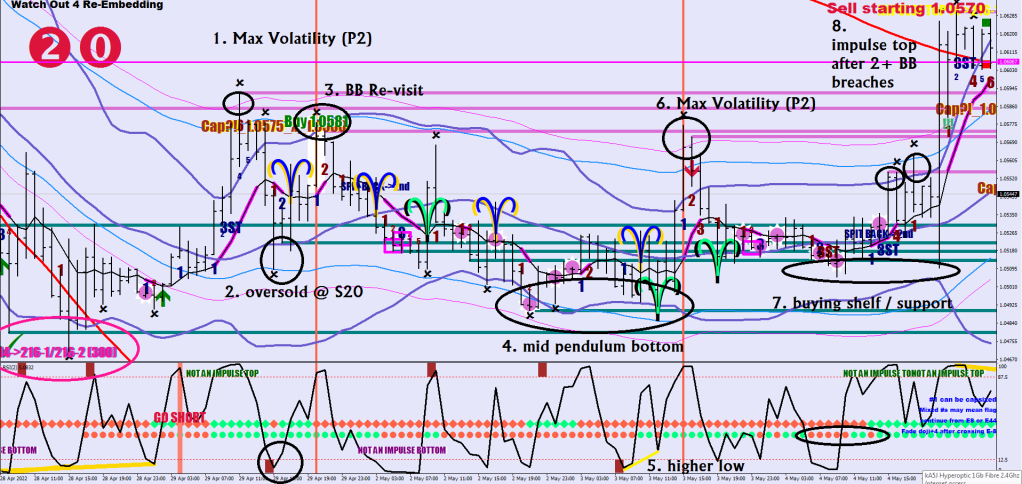
if ((PercentB <= -10) and (CI <= 24.56)) then "SLING SHOT!" else 
if ((PercentB < 0) and (CI < 35)) then "BOUNCE TO RESISTANCE" else 
if ((PercentB >= 128) and (CI <= 39.90)) then "TOP SUSPECTED" else
""), 
if ((PercentB <= -10) and (CI <= 24.56)) then Color.ORANGE else 
if ((PercentB < 0) and (CI < 35)) then Color.ORANGE else
if ((PercentB >= 128) and (CI >= 39.90)) then Color.GREEN else
Color.GRAY);


def down4 = ((CI > 40.60) and (CI < 44.61));


def down5 = (PercentB >= 110 and CI >= 41.50 and CI <= 42.50)  or (PercentB > 95 and CI < 34) or (PercentB >= 110 and CI < 44.50 and CI > 44.25) or (PercentB >= 132 and CI < 48)  or (PercentB >= 129 and CI < 56.50 and CI > 56) or (PercentB > 99 and CI > 61);

plot ArrowUp = if Up then low * 1 else Double.NaN;
# Adjust 0.995 according to how close you want the arrow to the price low
# Kudos to Richard for posting how to do this some time ago
ArrowUp.SetPaintingStrategy(PaintingStrategy.ARROW_UP);
ArrowUp.SetDefaultColor(Color.GREEN);
ArrowUp.SetLineWeight(4);


plot ArrowUp2 = if up2 then low * 0.999 else Double.NaN;
# Adjust 0.995 according to how close you want the arrow to the price low
# Kudos to Richard for posting how to do this some time ago
ArrowUp2.SetPaintingStrategy(PaintingStrategy.ARROW_UP);
ArrowUp2.SetDefaultColor(Color.CYAN);
ArrowUp2.SetLineWeight(4);


plot ArrowUp3 = if up3 then low * 0.999 else Double.NaN;
# Adjust 0.995 according to how close you want the arrow to the price low
# Kudos to Richard for posting how to do this some time ago
ArrowUp3.SetPaintingStrategy(PaintingStrategy.SQUARES);
ArrowUp3.SetDefaultColor(Color.WHITE);
ArrowUp3.SetLineWeight(5);


#plot ArrowUp4 = if up4 then low * 0.99 else Double.NaN;
# Adjust 0.995 according to how close you want the arrow to the price low
# Kudos to Richard for posting how to do this some time ago
#ArrowUp4.SetPaintingStrategy(PaintingStrategy.SQUARES);
#ArrowUp4.SetDefaultColor(Color.RED);
#ArrowUp4.SetLineWeight(5);


plot ArrowUp5 = if up5 then low * 0.999 else Double.NaN;
# Adjust 0.995 according to how close you want the arrow to the price low
# Kudos to Richard for posting how to do this some time 
ArrowUp5.SetPaintingStrategy(PaintingStrategy.POINTS);
ArrowUp5.SetDefaultColor(Color.ORANGE);
ArrowUp5.SetLineWeight(5);


plot ArrowUp6 = if up6 then low * 0.998 else Double.NaN;
# Adjust 0.995 according to how close you want the arrow to the price low
# Kudos to Richard for posting how to do this some time ago
ArrowUp6.SetPaintingStrategy(PaintingStrategy.SQUARES);
ArrowUp6.SetDefaultColor(Color.CYAN);
ArrowUp6.SetLineWeight(3);


plot ArrowDn = if Down <> Down2 then high * 1 else Double.NaN;
# Adjust 1.005 according to how close you want the arrow to the price high
# Kudos to Richard for posting how to do this some time ago
ArrowDn.SetPaintingStrategy(PaintingStrategy.ARROW_DOWN);
ArrowDn.SetDefaultColor(Color.RED);
ArrowDn.SetLineWeight(4);

plot ArrowDn2 = if Down2 then high * 1 else Double.NaN;
# Adjust 1.005 according to how close you want the arrow to the price high
# Kudos to Richard for posting how to do this some time ago
ArrowDn2.SetPaintingStrategy(PaintingStrategy.ARROW_DOWN);
ArrowDn2.SetDefaultColor(Color.YELLOW);
ArrowDn2.SetLineWeight(4);


plot ArrowDn3 = if down3 then high * 1 else Double.NaN;
# Adjust 1.005 according to how close you want the arrow to the price high
# Kudos to Richard for posting how to do this some time ago
ArrowDn3.SetPaintingStrategy(PaintingStrategy.ARROW_DOWN);
ArrowDn3.SetDefaultColor(Color.CYAN);
ArrowDn3.SetLineWeight(4);


plot ArrowDn4 = if down4 then high * 1.0002 else Double.NaN;
# Adjust 1.005 according to how close you want the arrow to the price high
# Kudos to Richard for posting how to do this some time ago
ArrowDn4.SetPaintingStrategy(PaintingStrategy.TRIANGLES);
ArrowDn4.SetDefaultColor(Color.WHITE);
ArrowDn4.SetLineWeight(4);


plot ArrowDn5 = if down5 then low * 1.001 else Double.NaN;
# Adjust 0.995 according to how close you want the arrow to the price low
# Kudos to Richard for posting how to do this some time ago
ArrowDn5.SetPaintingStrategy(PaintingStrategy.POINTS);
ArrowDn5.SetDefaultColor(Color.CYAN);
ArrowDn5.SetLineWeight(5);


plot ArrowDn6 = if (down6 and RSi2 > 75) then high * 1 else Double.NaN;
# Adjust 1.005 according to how close you want the arrow to the price high
# Kudos to Richard for posting how to do this some time ago
ArrowDn6.SetPaintingStrategy(PaintingStrategy.ARROW_DOWN);
ArrowDn6.SetDefaultColor(Color.ORANGE);
ArrowDn6.SetLineWeight(4);


input trailType = {default modified, unmodified};
input ATRPeriod = 5;
input ATRFactor = 3.5;
input firstTrade = {default long, short};

def HiLo = Min(high - low, 1.5 * Average(high - low, ATRPeriod));
def HRef = if low <= high[1]
    then high - close[1]
    else (high - close[1]) - 0.5 * (low - high[1]);
def LRef = if high >= low[1]
    then close[1] - low
    else (close[1] - low) - 0.5 * (low[1] - high);
def ATRMod = ExpAverage(Max(HiLo, Max(HRef, LRef)), 2 * ATRPeriod - 1);

def loss;
switch (trailType) {
case modified:
    loss = ATRFactor * ATRMod;
case unmodified:
    loss = ATRFactor * Average(TrueRange(high,  close,  low),  ATRPeriod);
}

rec state = {default init, long, short};
rec trail;
switch (state[1]) {
case init:
    if (!IsNaN(loss)) {
        switch (firstTrade) {
        case long:
            state = state.long;
            trail =  close - loss;
        case short:
            state = state.short;
            trail = close + loss;
    }
    } else {
        state = state.init;
        trail = Double.NaN;
    }
case long:
    if (close > trail[1]) {
        state = state.long;
        trail = Max(trail[1], close - loss);
    }
    else {
        state = state.short;
        trail = close + loss;
    }
case short:
    if (close < trail[1]) {
        state = state.short;
        trail = Min(trail[1], close + loss);
    }
    else {
        state = state.long;
        trail =  close - loss;
    }
}

def BuySignal = Crosses(state == state.long, 0, CrossingDirection.ABOVE);
def SellSignal = Crosses(state == state.short, 0, CrossingDirection.ABOVE);

plot TrailingStop = trail;

TrailingStop.SetPaintingStrategy(PaintingStrategy.POINTS);
TrailingStop.DefineColor("Buy", GetColor(0));
TrailingStop.DefineColor("Sell", GetColor(1));
TrailingStop.AssignValueColor(if state == state.long
    then TrailingStop.Color("Sell")
    else TrailingStop.Color("Buy"));

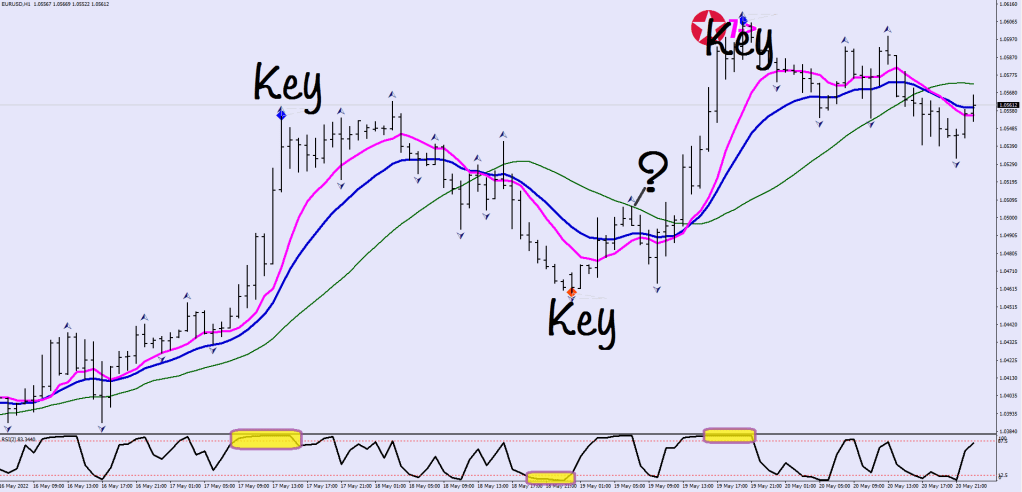
AddLabel(yes, Concat(Concat ("STOCH(10): " , SlowK),  Concat(" ULT:", UltOsc)), if SlowK <= 20 then Color.RED else (if SlowK >= 80 then Color.GREEN else Color.YELLOW));

AddLabel(yes, Concat("RSI2: " , RSi2), if RSi2 <= 2 then Color.RED else (if RSi2 >= 80 then Color.RED else Color.GREEN));

input accelerationFactor = 0.02;
input accelerationLimit = 0.2;

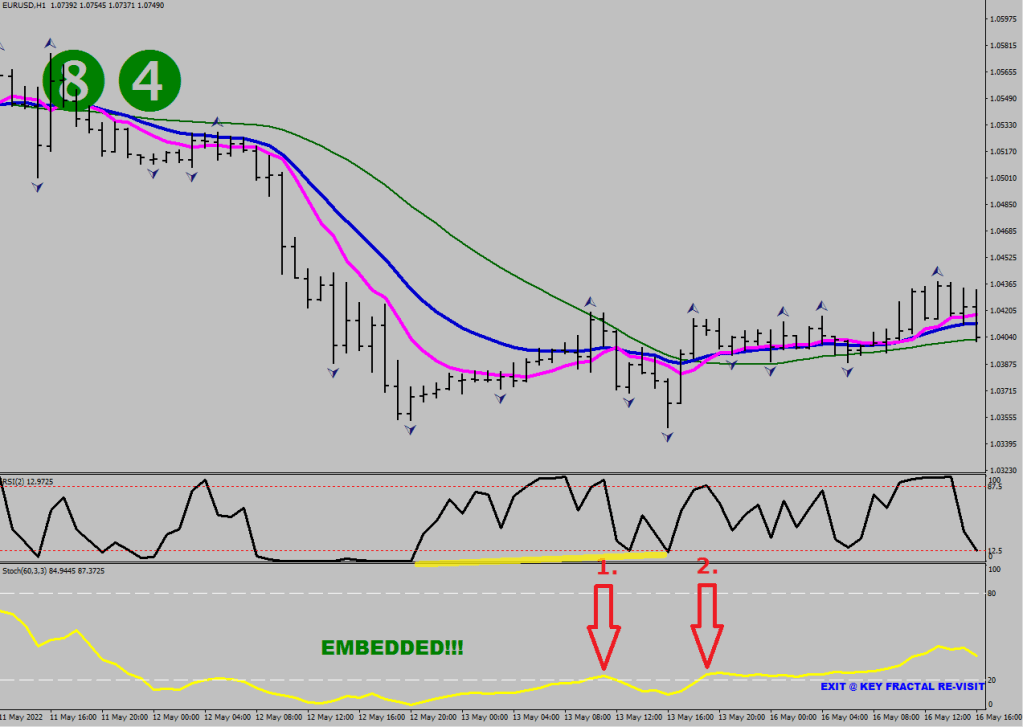
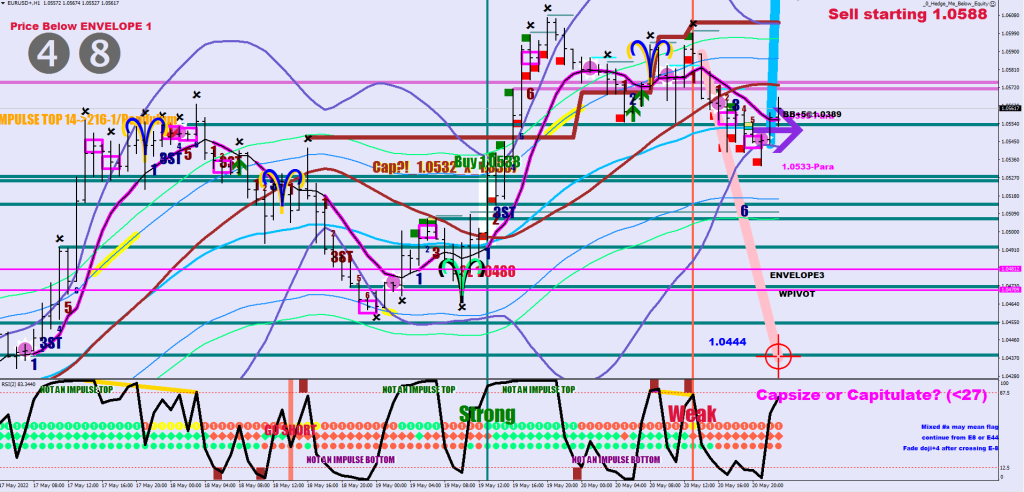
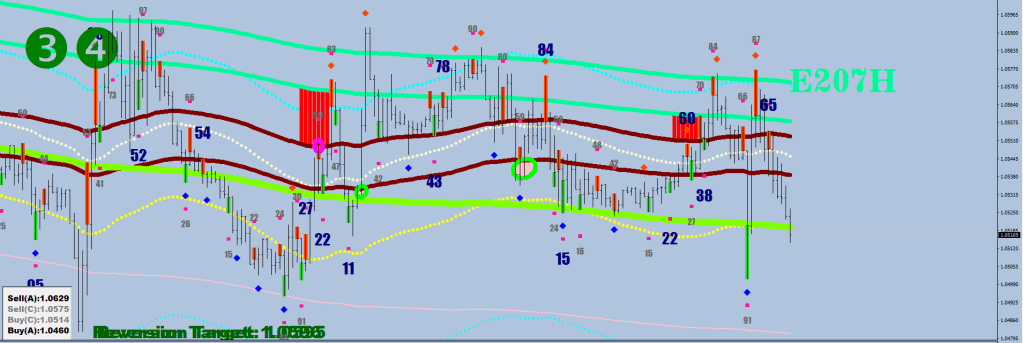
def PSAR_Ref = ParabolicSAR(accelerationFactor, accelerationLimit);

EMAs are 89 and 365.

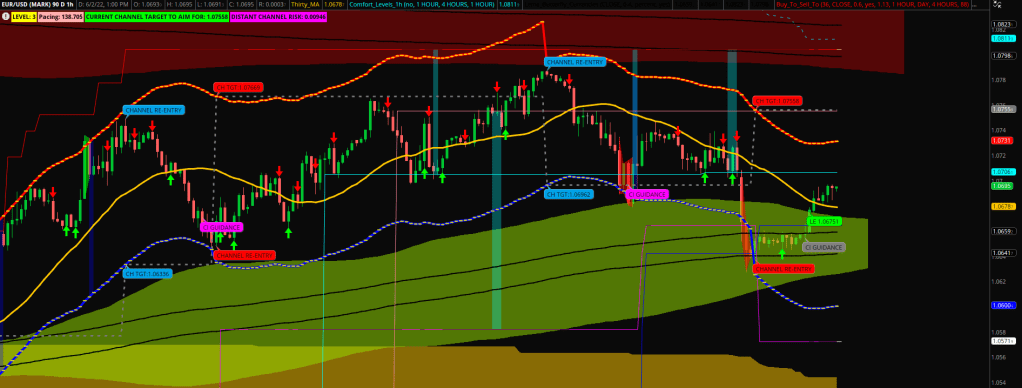
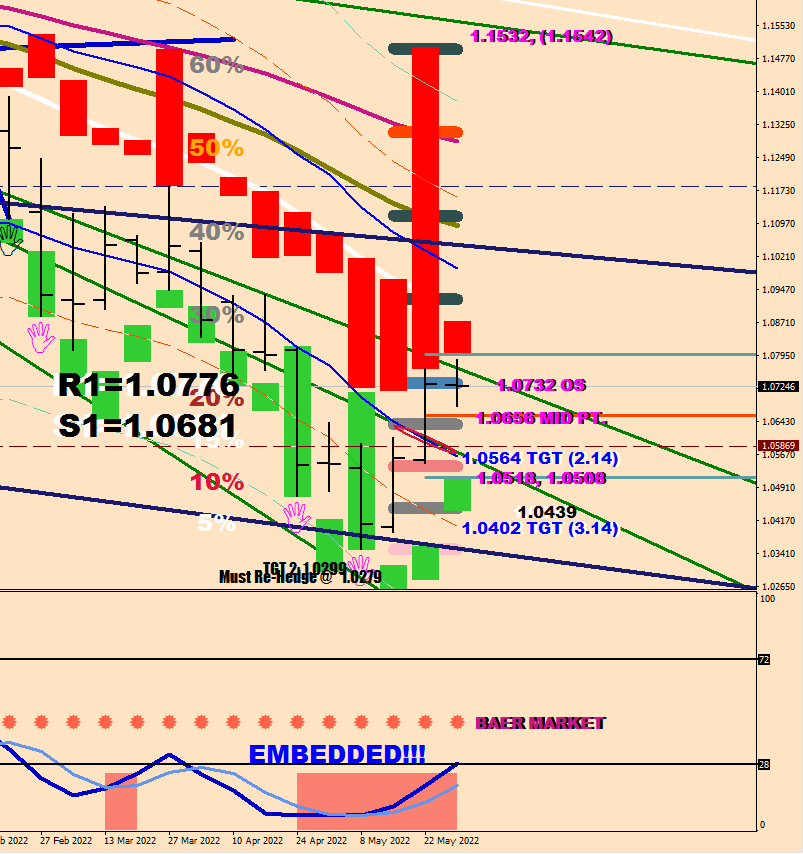
I guess the Comfort levels, the LEMAs and their fields and the CloseLines (E-36 channel crossback & targets) are almost as old ideas of mine.

Not much has changed.

No change, I can’t change.

Blood Funny

Let’s start with an intellectual joke.

I swear it’s not that complicated. If you rub it on your skin, it makes you live forever.

Eddie, have I told you about my condition?

Yea, the original title would had been Uno Memento.

The dark blue trendline was not the right one:

This green one was.

A couple of curiosities around today’s break: what the 1.0773 level meant for the algos.

  1. overbought neckline of the prior day’s range
Key fractal printed.

2. 2-sd break on the 14-sample RSI – the distance from the fresh high was only 15 pips!

Arrow on the bottom: the hedge level. Arrows on the left: Smart Monero sticking to the Man. Arrow on the top: cover some.

Emerald Yours

Yes, Mr. Archer, a blood diamond is one of the conditions where a pause is very likely.

A blood diamond is a fractal that is at the culmination of 5+ hours of pedal to the metal selling / buying measured by the hourly RSI2.

A key fractal needs less chiseling, 3 hours of max strength is enough and along with the re-visit of this key fractal an impulse top / bottom may be in the making.

Otherwise a 3rd fractal printing outside the S30HL2 based Bollinger Bands is a stall. The end result is always the same: buy / sell a lower high / higher low within 14 pips of the opposite Bollinger Band. Rinse and rinse.

 if (i>1 && iFractals(symbol,0,MODE_UPPER,i) && High[i]>iMA(symbol,0,44,0,MODE_EMA, PRICE_MEDIAN,i)+350*Point && RSI2[i+2]>82 && RSI2[i+1]>96 && (RSI2[i-1]<90  || RSI2[i-2]<90 )) EU[i]=High[i];
        if (i>1 && iFractals(symbol,0,MODE_UPPER,i) && High[i]>iMA(symbol,0,44,0,MODE_EMA, PRICE_MEDIAN,i)+350*Point && RSI2[i+5]>96 && RSI2[i+4]>96 && RSI2[i+3]>96 && RSI2[i+1]>96 && RSI2[i+1]>96 && (RSI2[i-1]<90  || RSI2[i-2]<90 )) EU2[i]=High[i];
        if (i>1 && iFractals(symbol,0,MODE_LOWER,i) && Low[i]<iMA(symbol,0,44,0,MODE_EMA, PRICE_MEDIAN,i)-350*Point && RSI2[i+2]<4 && RSI2[i+1]<4 && (RSI2[i-1]>10 || RSI2[i-2]>10 )) ED[i]=Low[i];
        if (i>1 && iFractals(symbol,0,MODE_LOWER,i) && Low[i]<iMA(symbol,0,44,0,MODE_EMA, PRICE_MEDIAN,i)-350*Point && RSI2[i+5]<4 && RSI2[i+4]<4 && RSI2[i+3]<4 && RSI2[i+2]<4 && RSI2[i+1]<4 && (RSI2[i-1]>10 || RSI2[i-2]>10 )) ED2[i]=Low[i];

///higher low

if (i>1 && Low[i]<Low[i+1] && Low[i]<Low[i-1] 
 && iClose(symbol,0,0)>iMA(symbol,1440,20,0,MODE_EMA, PRICE_CLOSE,0)
      && Low[i]<iBands(symbol,0,30,2,0,PRICE_MEDIAN,MODE_LOWER,i)+140*Point &&  iLow(symbol,0,i)>iLow(symbol,0,iLowest(symbol,0,MODE_LOW,8,i+2))
   ){
      ObjectCreate("VALIyy"+IntegerToString(i), OBJ_TEXT, 0, Time[i], High[i]-50*Point); 
        ObjectSetText("VALIyy"+IntegerToString(i), CharToStr(102), 66, "Wingdings", Black); 
        ObjectCreate("VALIxy"+IntegerToString(i), OBJ_TEXT, 0, Time[i], High[i]-50*Point); 
        ObjectSetText("VALIxy"+IntegerToString(i), CharToStr(102), 56, "Wingdings", Cyan); 
  }

     ///lower high

if (i>1 && High[i]>High[i+1] && High[i]>High[i-1] 
 && iClose(symbol,0,0)<iMA(symbol,1440,20,0,MODE_EMA, PRICE_CLOSE,0)
      && High[i]>iBands(symbol,0,30,2,0,PRICE_MEDIAN,MODE_UPPER,i)-140*Point && iHigh(symbol,0,i)<iHigh(symbol,0,iHighest(symbol,0,MODE_HIGH,8,i+2))
   ){
      ObjectCreate("VALIyy"+IntegerToString(i), OBJ_TEXT, 0, Time[i], High[i]-50*Point); 
        ObjectSetText("VALIyy"+IntegerToString(i), CharToStr(248), 66, "Wingdings", Black); 
        ObjectCreate("VALIxy"+IntegerToString(i), OBJ_TEXT, 0, Time[i], High[i]-50*Point); 
        ObjectSetText("VALIxy"+IntegerToString(i), CharToStr(248), 56, "Wingdings", Cyan); 
  }

The definition of the Baer market is unchanged, the Bare lives on until there will be 3 weekly closes above the 55EMA from then on, we’ll be talking of a Krull market. Luckily in Forex up is up and down is down.

////3 closes below E-55
              if (Close[i]<iMA(symbol,0,55,0,MODE_EMA, PRICE_MEDIAN,i) && Close[i+1]<iMA(symbol,0,55,0,MODE_EMA, PRICE_MEDIAN,i+1) && Close[i+2]<iMA(symbol,0,55,0,MODE_EMA, PRICE_MEDIAN,i+2) && High[i+3]>iMA(symbol,0,55,0,MODE_EMA, PRICE_MEDIAN,i+3)   && Close[i+4]>iMA(symbol,0,59,0,MODE_EMA, PRICE_MEDIAN,i+4)    ){
         ObjectCreate("TitusTFxx"+DoubleToStr(i), OBJ_TEXT, 0, Time[i+1], Close[i+1]+290*Point); 
            ObjectSetText("TitusTFxx"+DoubleToStr(i), CharToStr(74), 39, "Wingdings", clrFireBrick);
            ObjectCreate("Claims"+DoubleToStr(i), OBJ_TEXT, 0, Time[i+1],  Close[i+1]+350*Point); 
                      ObjectSetText("Claims"+DoubleToStr(i), "REAR MARKET", 18, "Impact", clrCrimson);
                      Market[i]=-1;

Ever since the Brae market started, this is the first example where a new leg starting does not coincide with a CAP print to the exact day. There is a reason why I add a moratorium field (Must+Number) beyond the CAP itself. Overnight you need to figure in the broker’s 0.2 pips spread being expanded to 20 pips (plus slippage) so they don’t pick up your hedge order by chance of fate.

These two CAPs failed to align the candle color right on the same day, yet the balance of powers was tipped irreversibly.

I swear if DeMark was never born, I still would have used 4-sample higher high / lower low – it’s not that complicated. I have a name for it : Hyperloop.


   ///////4-candle high closing back down 27-pips cover
   
     if (iHigh(symbol,0,iHighest(symbol,0,MODE_HIGH,1,i))==iHigh(symbol,0,iHighest(symbol,0,MODE_HIGH,4,i)) && Close[i]<iHigh(symbol,0,iHighest(symbol,0,MODE_HIGH,2,i))-270*Point

The CAPs don’t show up at random places.

There is some asymmetry is going on currently, the bottom “CAP” lows are further sorted based on the 18-sample stochastic reading, the too oversold ones are not called CAPs.

 if (st18[i]<9.5) { ObjectSetText("Bingo"+IntegerToString(i), "CAP", 26, "Impact", DarkGreen); momentum[i]=1;
         if (st18[ArrayMinimum(st18,10,i+1)]<4.4) {ObjectSetText("Bingo"+IntegerToString(i), "Cos,+90,-DVG", 26, "Impact", LimeGreen); c77[i]=true;
         if (c77[i+1]) {
         ObjectSetText("Bingo"+IntegerToString(i), "C111-os,+175,-DVG", 26, "Impact", LimeGreen); c77[i]=true;}
         }
       }
       if (st18[i]<9.0 && i>0 && Close[i-1]<Open[i-1]) {ObjectSetText("Bingo"+IntegerToString(i), "C77uc", 26, "Impact", LimeGreen); c77[i]=true;
       momentum[i]=-1; momentum[i-1]=-1;

I suppose I would have to split up the upper range in a similar manner once the Hull market would be here.

The way I figure the Embedding on the weekly chart still shows downside embedding VS Ira Epstein.

I’m more interested in the signal line than the duet.

if (iStochastic(symbol,10080,18,3,3,MODE_SMA,0,MODE_SIGNAL,i+2)<24 && iStochastic(symbol,10080,18,3,3,MODE_SMA,0,MODE_SIGNAL,i+1)<24 && iStochastic(symbol,10080,18,3,3,MODE_SMA,0,MODE_SIGNAL,i)<24 ){
 
                     ObjectCreate("Fracabbb"+IntegerToString(i), OBJ_RECTANGLE, 1,  Time[i+1], 24, Time[i], 0);
                     ObjectSetInteger(0,"Fracabbb"+IntegerToString(i),OBJPROP_COLOR,clrSalmon);
                     ObjectSet("Fracabbb"+IntegerToString(i),OBJPROP_BACK,1);
                     ObjectSet("Fracabbb"+IntegerToString(i),OBJPROP_WIDTH,5);   
                     embedded[i]=true;

In Hungaian this one is referred to as The Thinking Man (A gondolkodo ember).

The rodent comes from wasting lives let it be animal or human and investors wealth by blowing up rockets and by ultimately sealing the fate of the stock.

Developments

Can’t get a better zoom, but here’s the deal.

If today closes down from whichever high would be final, this day would have a CAP print on it, as in CAPSIZE attempt.

Let’s talk NBEs first.

A No Break Extension is relative to the consolidation weight. It means that the price aka investment vehicle can move about on a station (middle is the purple arrow / line) about 46 pips in case of the EUR/USD without printing a valid break out (leeway).

The weight is calculated with a Choppiness Print going above 53 on the 15-min timeframe with 48 samples.

This finds the first such 15-min candle. The weight would be the half point.

 i=0;
   while (i<200){
      if (ChoppinessIndex(12*4,i)>53 && ChoppinessIndex(12*4,i+1)<53) break;
   i++;

Second, let’s mention about the Railroad Tracks.

The railroad tracks are brought on by the lack of remaining energy and the need for the quickest possible consolidation on the fly to eek out a final push. I’m pretty sure there is a blog entry about this somewhere by the title of Railroad T-Rex or something. Knowing myself I always must put a twist on everything.

The coming correction would take price at the most bullish of scenarios to beyond the 40, but shy of 50% retracement area.

To anticipate the end of the pullback, you would be looking for an impulse bottom with an RSI2 divergence, but pay also attention to the 60-sample hourly stochastics. The correction would likely take the price oversold twice.

The image shows 2 hook backs of the main line.

Now, let’s not forget about the embedding part.

Unfortunately, at the moment the 60-sample stoch is embedded to the upside. This means 10+ hours of overbought condition of the signal line.

if (i<20 && (iStochastic(symbol,60,60,3,3,MODE_SMA,0,MODE_SIGNAL,i+9)+iStochastic(symbol,60,60,3,3,MODE_SMA,0,MODE_SIGNAL,i+8)+iStochastic(symbol,60,60,3,3,MODE_SMA,0,MODE_SIGNAL,i+7)+iStochastic(symbol,60,60,3,3,MODE_SMA,0,MODE_SIGNAL,i+6)+iStochastic(symbol,60,60,3,3,MODE_SMA,0,MODE_SIGNAL,i+5)+iStochastic(symbol,60,60,3,3,MODE_SMA,0,MODE_SIGNAL,i+4)+iStochastic(symbol,60,60,3,3,MODE_SMA,0,MODE_SIGNAL,i+3)+iStochastic(symbol,60,60,3,3,MODE_SMA,0,MODE_SIGNAL,i+2)+iStochastic(symbol,60,60,3,3,MODE_SMA,0,MODE_SIGNAL,i+1)+iStochastic(symbol,60,60,3,3,MODE_SMA,0,MODE_SIGNAL,i)<180 && iStochastic(symbol,60,60,3,3,MODE_SMA,0,MODE_SIGNAL,i)<20) 
|| (iStochastic(symbol,60,60,3,3,MODE_SMA,0,MODE_SIGNAL,i+9)+iStochastic(symbol,60,60,3,3,MODE_SMA,0,MODE_SIGNAL,i+8)+iStochastic(symbol,60,60,3,3,MODE_SMA,0,MODE_SIGNAL,i+7)+iStochastic(symbol,60,60,3,3,MODE_SMA,0,MODE_SIGNAL,i+6)+iStochastic(symbol,60,60,3,3,MODE_SMA,0,MODE_SIGNAL,i+5)+iStochastic(symbol,60,60,3,3,MODE_SMA,0,MODE_SIGNAL,i+4)+iStochastic(symbol,60,60,3,3,MODE_SMA,0,MODE_SIGNAL,i+3)+iStochastic(symbol,60,60,3,3,MODE_SMA,0,MODE_SIGNAL,i+2)+iStochastic(symbol,60,60,3,3,MODE_SMA,0,MODE_SIGNAL,i+1)+iStochastic(symbol,60,60,3,3,MODE_SMA,0,MODE_SIGNAL,i)>880 && iStochastic(symbol,60,60,3,3,MODE_SMA,0,MODE_SIGNAL,i)>80)){

The daily stochastic is also embedded to the upside.

if ((iStochastic(symbol,1440,18,3,3,MODE_SMA,0,MODE_SIGNAL,0)>76 && iStochastic(symbol,1440,18,3,3,MODE_SMA,0,MODE_MAIN,0)>76 && iStochastic(symbol,1440,18,3,3,MODE_SMA,0,MODE_SIGNAL,1)>76 && iStochastic(symbol,1440,18,3,3,MODE_SMA,0,MODE_MAIN,1)>76 && iStochastic(symbol,1440,18,3,3,MODE_SMA,0,MODE_SIGNAL,2)>76 && iStochastic(symbol,1440,18,3,3,MODE_SMA,0,MODE_MAIN,2)>76 )
|| (iStochastic(symbol,1440,18,3,3,MODE_SMA,0,MODE_SIGNAL,0)<24 && iStochastic(symbol,1440,18,3,3,MODE_SMA,0,MODE_MAIN,0)<24 && iStochastic(symbol,1440,18,3,3,MODE_SMA,0,MODE_SIGNAL,1)<24 && iStochastic(symbol,1440,18,3,3,MODE_SMA,0,MODE_MAIN,1)<24 && iStochastic(symbol,1440,18,3,3,MODE_SMA,0,MODE_SIGNAL,2)<24 && iStochastic(symbol,1440,18,3,3,MODE_SMA,0,MODE_MAIN,2)<24 )){

& at the same time the Weekly Stochastic is embedded to the downside, close to losing this with the coming weekly print.

if (iStochastic(symbol,10080,18,3,3,MODE_SMA,0,MODE_SIGNAL,i+2)<24 && iStochastic(symbol,10080,18,3,3,MODE_SMA,0,MODE_SIGNAL,i+1)<24 && iStochastic(symbol,10080,18,3,3,MODE_SMA,0,MODE_SIGNAL,i)<24 ){

…and further complication is that the long term oversold level is at 1.0732 – the blue bob with the 20% label before it.

& price is a stone throw away from printing a God Day one. If this falls back, but not too far away (similar to the drop that was about 110 pips earlier) and comes back, this would mean a major break out having tested the oversold neckline twice. The biggest moves occur from leaving the long term oversold / overbought condition, i.e. the first target would be the 50% line, the second is the other side of the range (opposing 20% neckline).

One last piece of evidence is for the Bears, and this is the head and shoulders being drawn from the 9-day EMA. See the sequence below of 3.9x, 4.5x and 3x for LHR.

Bye now.

CF

The original intent of the Candle Fabricator was to combine daily candles if one of them was shaven for instance to acknowledge the limitations that come with a steady pace of grouping data.

In reality it takes a lot of work to plug in values.

This is an aftermath, nodding to just using the things that are easy to get access to. A defeat & a surrender.

Finally, the market is making an extension before a more complex reversal back down.

What is important here is to notice the inside, down daily candle’s 20% level (red line) was put pressure on at the open and since the market has been trending higher. The 80% was also back tested during the break out.

The daily Stoch is now at 72, so a marginal higher high tomorrow would probably put this in the reversal range.


////Draw those candles

deletetxt1("Candle");

ObjectCreate("Candle0", OBJ_RECTANGLE, 0,  Time[8], iHigh(symbol,10080,0), Time[9], iLow(symbol,10080,0));
           if ((iHigh(symbol,10080,0)+iLow(symbol,10080,0))/2>Close[0]) ObjectSetInteger(0,"Candle0",OBJPROP_COLOR,clrTomato);
           else ObjectSetInteger(0,"Candle0",OBJPROP_COLOR,clrPaleTurquoise);
            ObjectSet("Candle0",OBJPROP_BACK,0);
            ObjectSet("Candle0",OBJPROP_WIDTH,5);
   ObjectCreate( "Candle0_", OBJ_TREND, 0, Time[7], Close[0], Time[10], Close[0]);
        ObjectSet("Candle0_", OBJPROP_COLOR, clrBlack ); ObjectSet("Candle0_", OBJPROP_BACK, 1 );
          ObjectSet("Candle0_", OBJPROP_STYLE, 2 );
          ObjectSet("Candle0_", OBJPROP_RAY_RIGHT, false );
               ObjectSet("Candle0_", OBJPROP_WIDTH, 3 );  


 ObjectCreate("Candle1", OBJ_RECTANGLE, 0,  Time[10], last_candle_high, Time[11], last_candle_low);
           if ((last_candle_high+last_candle_low)/2>last_candle_close) ObjectSetInteger(0,"Candle1",OBJPROP_COLOR,clrTomato);
           else ObjectSetInteger(0,"Candle1",OBJPROP_COLOR,clrPaleTurquoise);
            ObjectSet("Candle1",OBJPROP_BACK,1);
            ObjectSet("Candle1",OBJPROP_WIDTH,5);
   ObjectCreate( "Candle1_", OBJ_TREND, 0, Time[9], last_candle_close, Time[12], last_candle_close);
        ObjectSet("Candle1_", OBJPROP_COLOR, clrGold ); ObjectSet("Candle1_", OBJPROP_BACK, 1 );
          ObjectSet("Candle1_", OBJPROP_STYLE, 2 );
          ObjectSet("Candle1_", OBJPROP_RAY_RIGHT, false );
               ObjectSet("Candle1_", OBJPROP_WIDTH, 6 );  


 ObjectCreate("Candle2", OBJ_RECTANGLE, 0,  Time[12], prior_candle_high, Time[13], prior_candle_low);
           if ((prior_candle_high+prior_candle_low)/2>prior_candle_close) ObjectSetInteger(0,"Candle2",OBJPROP_COLOR,clrTomato);
           else ObjectSetInteger(0,"Candle2",OBJPROP_COLOR,clrPaleTurquoise);
            ObjectSet("Candle2",OBJPROP_BACK,1);
            ObjectSet("Candle2",OBJPROP_WIDTH,5);
   ObjectCreate( "Candle2_", OBJ_TREND, 0, Time[11], prior_candle_close, Time[14], prior_candle_close);
        ObjectSet("Candle2_", OBJPROP_COLOR, clrGold ); ObjectSet("Candle2_", OBJPROP_BACK, 1 );
          ObjectSet("Candle2_", OBJPROP_STYLE, 2 );
          ObjectSet("Candle2_", OBJPROP_RAY_RIGHT, false );
               ObjectSet("Candle2_", OBJPROP_WIDTH, 6 );  


ObjectCreate( "CandleC", OBJ_HLINE, 0, Time[0], Close[0]);
        ObjectSet("CandleC", OBJPROP_COLOR, clrBlack ); ObjectSet("Candle2_", OBJPROP_BACK, 1 );
          ObjectSet("CandleC", OBJPROP_STYLE, 2 );
               ObjectSet("CandleC", OBJPROP_WIDTH, 1 );  


///50% 
ObjectCreate( "Candle5", OBJ_HLINE, 0, Time[0], (last_candle_high+last_candle_low)/2);
        ObjectSet("Candle5", OBJPROP_COLOR, clrGray ); ObjectSet("Candle5_", OBJPROP_BACK, 0 );
          ObjectSet("Candle5", OBJPROP_STYLE, 1 );
               ObjectSet("Candle5", OBJPROP_WIDTH, 1 );  

 ObjectCreate("Candle50", OBJ_TEXT, 0, Time[0], (last_candle_high+last_candle_low)/2+90*Point); 
 ObjectSetText("Candle50", "               50%="+NormalizeDouble((last_candle_high+last_candle_low)/2,4)+" Size: "+NormalizeDouble(AccountEquity()/2/1000*.5,2)+" Lots", 12, "Arial Black", clrNavy);


///80% 
if ((last_candle_high+last_candle_low)/2<last_candle_close) ObjectCreate( "Candle8", OBJ_HLINE, 0, Time[0], (last_candle_high-last_candle_low)/5+last_candle_low);
else ObjectCreate( "Candle8", OBJ_HLINE, 0, Time[0], last_candle_high-(last_candle_high-last_candle_low)/5);
ObjectSet("Candle8", OBJPROP_COLOR, clrDarkGreen ); ObjectSet("Candle5_", OBJPROP_BACK, 0 );
ObjectSet("Candle8", OBJPROP_STYLE, 1 );
ObjectSet("Candle8", OBJPROP_WIDTH, 1 );  

if ((last_candle_high+last_candle_low)/2<last_candle_close) {ObjectCreate("Candle80", OBJ_TEXT, 0, Time[0], (last_candle_high-last_candle_low)/5+last_candle_low+90*Point); 
 ObjectSetText("Candle80", "               80%="+NormalizeDouble((last_candle_high-last_candle_low)/5+last_candle_low,4)+" Size: "+NormalizeDouble(AccountEquity()/2/1000*.8,2)+" Lots", 12, "Arial Black", clrNavy);
}
else { ObjectCreate("Candle80", OBJ_TEXT, 0, Time[0], last_candle_high-(last_candle_high-last_candle_low)/5+90*Point); 
 ObjectSetText("Candle80", "               80%="+NormalizeDouble(last_candle_high-(last_candle_high-last_candle_low)/5,4)+" Size: "+NormalizeDouble(AccountEquity()/2/1000*.8,2)+" Lots", 12, "Arial Black", clrNavy);}


///20% 
if ((last_candle_high+last_candle_low)/2>last_candle_close) ObjectCreate( "Candle20", OBJ_HLINE, 0, Time[0], (last_candle_high-last_candle_low)/5+last_candle_low);
else ObjectCreate( "Candle20", OBJ_HLINE, 0, Time[0], last_candle_high-(last_candle_high-last_candle_low)/5);
ObjectSet("Candle20", OBJPROP_COLOR, clrCrimson ); ObjectSet("Candle5_", OBJPROP_BACK, 0 );
ObjectSet("Candle20", OBJPROP_STYLE, 1 );
ObjectSet("Candle20", OBJPROP_WIDTH, 1 );  

if ((last_candle_high+last_candle_low)/2>last_candle_close) {ObjectCreate("Candle200", OBJ_TEXT, 0, Time[0], (last_candle_high-last_candle_low)/5+last_candle_low+90*Point); 
ObjectSetText("Candle200", "               20%="+NormalizeDouble((last_candle_high-last_candle_low)/5+last_candle_low,4)+" Size: "+DoubleToStr(NormalizeDouble(AccountEquity()/2/1000*.2,2),2)+" Lots", 12, "Arial Black", clrNavy);
}

else {ObjectCreate("Candle200", OBJ_TEXT, 0, Time[0], last_candle_high-(last_candle_high-last_candle_low)/5+90*Point); 
 ObjectSetText("Candle200", "               20%="+NormalizeDouble(last_candle_high-(last_candle_high-last_candle_low)/5,4)+" Size: "+DoubleToStr(NormalizeDouble(AccountEquity()/2/1000*.8,2),2)+" Lots", 12, "Arial Black", clrNavy);}


///100% 
if ((last_candle_high+last_candle_low)/2>last_candle_close) ObjectCreate( "Candle10", OBJ_HLINE, 0, Time[0], last_candle_high);
else ObjectCreate( "Candle10", OBJ_HLINE, 0, Time[0], last_candle_low);
ObjectSet("Candle10", OBJPROP_COLOR, clrGray ); ObjectSet("Candle5_", OBJPROP_BACK, 0 );
ObjectSet("Candle10", OBJPROP_STYLE, 1 );
ObjectSet("Candle10", OBJPROP_WIDTH, 1 );  

if ((last_candle_high+last_candle_low)/2>last_candle_close) {ObjectCreate("Candle100", OBJ_TEXT, 0, Time[0], last_candle_high+90*Point); 
ObjectSetText("Candle100", "              100%="+NormalizeDouble(last_candle_high,4)+" Size: "+DoubleToStr(NormalizeDouble(AccountEquity()/2/1000,2),2)+" Lots", 12, "Arial Black", clrNavy);
}

else {ObjectCreate("Candle100", OBJ_TEXT, 0, Time[0], last_candle_low+90*Point); 
 ObjectSetText("Candle100", "              100%="+NormalizeDouble(last_candle_low,4)+" Size: "+DoubleToStr(NormalizeDouble(AccountEquity()/2/1000,2),2)+" Lots", 12, "Arial Black", clrNavy);}


//// label


ObjectCreate("Candle400", OBJ_TEXT, 0, Time[0], last_candle_high+(last_candle_high-last_candle_low)/5); 
ObjectSetText("Candle400", "              The Don't Come Back Kids", 12, "Arial Black", clrNavy);


//percentage print


   ObjectCreate("CandleP", OBJ_TEXT, 0, Time[5], Close[0]+90*Point); 
               
   if ((last_candle_high+last_candle_low)/2>last_candle_close)           
               
               ObjectSetText("CandleP", "  "+DoubleToStr(
               NormalizeDouble(100-(last_candle_high-Close[0])/(last_candle_high-last_candle_low)*100,2)
               ,2)+"%", 12, "Arial Black", clrIndigo);
   else       ObjectSetText("CandleP", "  "+DoubleToStr(
               NormalizeDouble((Close[0]-last_candle_low)/(last_candle_high-last_candle_low)*100,2)
               ,2)+"%", 12, "Arial Black", clrIndigo);

& the declaration

double last_candle_high = iHigh(symbol,1440,1);
double last_candle_low = iLow(symbol,1440,1);
double last_candle_close = iClose(symbol,1440,1);

double prior_candle_high = iHigh(symbol,1440,2);
double prior_candle_low = iLow(symbol,1440,2);
double prior_candle_close = iClose(symbol,1440,2);

Vangelis died as well as Klaus Shulze this year.

Keying In On A Vision

Your centralized vision has a dual mandate: to see and to spot.

It is hard to see through a cloud of blur, to peer through a flatu-lenses.

So let’s hone in.

What has changed this week?

The company name… and along with it my trading philosophy.

May 14-20

Let’s cut to the chase.

Bottoms and less tops we’ve been talking of.

The key fractal is a fractal that is outside the pendulum’s body, it jams the hourly RSI2 to the floor for hours and is followed by an RSI2 relief.

if (i>1 && iFractals(symbol,0,MODE_UPPER,i) && High[i]>iMA(symbol,0,44,0,MODE_EMA, PRICE_MEDIAN,i)+350*Point && RSI2[i+2]>96 && RSI2[i+1]>96 && (RSI2[i-1]<90  || RSI2[i-2]<90 )) EU[i]=High[i];
        if (i>1 && iFractals(symbol,0,MODE_LOWER,i) && Low[i]<iMA(symbol,0,44,0,MODE_EMA, PRICE_MEDIAN,i)-350*Point && RSI2[i+2]<4 && RSI2[i+1]<4 && (RSI2[i-1]>10 || RSI2[i-2]>10 )) ED[i]=Low[i];

The one thing nobody seems to be making a study out of is the sequence of events.

You are not going to know if you have seen the key fractal until the ink dries on the RSI 2 hours later, hence price needs to be taken back to it for a dump.

What is the question mark called? Low key.

The fractal has 4 values, such as OHLC. In case of a measuring leg you can expect all of those values to be beaten if not briefly settled nearby with a handful of pips to show for at most.

In case of a divergent leg, the re-visit may choke at the second closest level of the OHLC.

Some Florida Keys for you.

What now?

We are headed to the 50EMA. Momentum is up, the temporary weakness was relieved by the daily candle being connected back to the 20EMA, closed right at the break-out level of the prior leg.

1.0682-1.0748

Didn’t I say that a Key is where the turn is?

Well, the pendulum band starts at around 1.0515. It is possible that this correction is not over yet, we merely saw the max volatility move and now the continuation divergence would print above the S30.

Without further consolidation, these are the statistical probability moves from here:

The previous leg down fell shy of the orange line by 40 pips when it was making a run for it. A similar magnitude move would equate to 1.0485.

Ideally there would be a third row print, i.e. close(s) below the shadow line (at 1.0521 currently), but we also need to consider that things are becoming more and more bullish on the way up and less and less may just be enough from here on.

Based on the stochastic bars, a head may be missing still.

All in all, keep shorts on a short leash (trail stop) & hold on tight…

Make or Wake?

Do or Why?

The subject is evaluation of the success of an impulse bottom.

First, an example of a successful Impulse bottom.

The maximum volatility move (first cube) is followed by the first pullback (#1 fractal) below the Hourly S30 moving average. The second fractal (#2) with the corresponding lower RSI2 print (second cube) is meant to be the higher low, and should not be violated.

The second example is of a not successful impulse bottom.

#2 was undercut a number of times. There was still a C leg taking price above the maximum volatility leg by 50 pips, but in terms of the impulse bottom, it did not prompt a reversal, the sideways action was a pause within the larger move,

Now, try to explain what went wrong with this impulse bottom:

…and what is right with this current one so far?

Opposites retract.

The Full Bounty

Do yourself a favor and plot some Bollinger Bands and a 9-day EMA (on medians) on your daily chart.

Try to identify out of the last 67 trading days, how many candles do not touch any one of the 4 lines.

I found these.

First thing to draw as a conclusion, is less than 1 out of 6 candles were left hanging (levitating with high libido). Or rather, they were not left alone: this “highly unstable” condition is a high ball for a slam dunk. Usually they get pushed onto one of the lines the very next day. The market prefers to be in a low energy condition.

Now, if we pay attention to the color, the ones that seemed to be in favor of bouncing up were those with a positive charge (pink candle) or a doji at the end of a cascade.

The black ones with their negative charges were either connected to the lower line or left alone hurdling in space until the space jam arm reached in, but by then the negative charge got reversed.

The sample size is not enormous, I am citing these things as curiosities and I fully expect the 9-day EMA to be re-connected on Monday, is all.

The Name of Game

Why don’t you talk to me… Won’t you come, won’t you come right now.

Music used to be so important. For instance, if you told me that your childhood was Crockett’s Theme, Paninaro and Maniacs of Noise, I would know exactly where you grew up: in Europe, a little to the south east (in the reception area of Croatia), grew up in the 80s and had an Amiga computer.

Mother, do you think they’ll try to break my bones?

Chartreuse = lower guard rail. Yesterday’s low was undercut by 22.5 pips.

Every tick you take, every pip you make, I’ll be watching you.

This pain is just too real.

Oooh-oooh-ooh the tide is turning.

I’m not saying the battle is won…

Bare Naked Notes

In a Bare market below Envelope 1 only Impulsive bottoms can trigger a counter directional rally that would last multiple days and would achieve in excess of a 100 pips from the recent low.

I use 3.5 and 5.55 for the other two displacements.

The first, red bottom example managed to start a rally that had multiple legs (3), of which the first one performed 320+ pips in order to carry out a kiss goodbye move to the dashed line.

Red bottom = 216 sample hourly lower low trigger leg.

On a close up, this is what went down.

The initial Max Vol move off of the divergent leg of the impulse bottom the RSI2 made only 1 dip below 12.5 for a continuation divergence.

The next counter move came off of a yellow impulse bottom.

The yellow bottom is an “inside bottom” the trigger leg was not a 216-sample hourly lower low itself.

It had a clear, 5-wave looks with RSI2 only dipping below 12.5 at the end of Wave 2 and Wave 4.

Interestingly, the top itself was a correction / continuation high. The rally length was 176 pips.

The current complex bottom had a red impulse low that was itself an inside leg, but the trigger leg had 216 empty hours before it.

There was a re-embedding of the 18-sample stochastic for another move down that made another inside impulse low. Blowing past the cover low would mean a capitulation. 171 pips.

This 153-pip move up was a serious labor. RSI2 goes too deep on this timeframe. By S20 I meant S30.

On the 4-Hour the RSI2 picture looks clean, but the pattern seems to be a broadening formation where the #2 low is lower than the trigger low and the #4 is lower still.

Based on this, leg 5 is proposed to be disappointing in length, yet it could also trigger a break-out at the white-out. Or it could be the place to pull on the toilet-chain.

Bare Market Ladies

If you had to ask, this was another inside, yellow impulse bottom. My routines did not pick it up because the close below exceeded 2 pips (7) and I’m looking for a range of 14 not 15 by standard.

(with those two temporary changes the plot would appear)

The likelihood is that the 1.0470 low is gonna get undercut as well if the lower trendline gets violated. Not sure by how much, could be anything from 1.0444 (projeced distance on the left in green) to almost 1.04.

The easiest market can be for you the hardest when you don’t know what the rules are.

Breaking The CAP

What is a CAP?

Pendulum inner band in blue, Pendulum outer in purple.

A CAP is short for a capsize attempt. An hourly separation from the 8EMA of Hourly Opens that ends up closing in opposition to the opening direction.

I use the second pendulum band (E-44 +-45 pips) as a filter to stay away from the trending mode.

The low / high would have to be inside the pendulum (E-44 +-35 pips) for the “Sell” plot to be displayed by an additional 2 pips.

The trap range mentioned is between the half of the candle and its end point plus 2 pips slack. The sell is yet another pip out.

For the remainder of this page we’re gonna take a look at the Impulse Top that was indeed a Vostroff Deccumulation.

An impulse move trails off with an RSI divergence. Not an impulse bottom does not mean not a corrective bottom, it just rules out one possibility due to strength.

The pattern was valid for the 13th hour did not get away from the trigger high by 50+ pips. The Entry was on the 14th candle anywhere above the 13th’s close.

Forgot to mention, the next candle has to confirm the capsize attempt.