Momentum flips with today closing back up 27 pips and Stochastic in the reversal range.The image for the ages. Price was staying oversold right before the final capitulation act.
This move to -135 – I buy it for a left shoulder. 135 is not all that different from 65 in the mirror, now is it?
What next?
A move to the overbought. (Good old example image below) If price does not manage to achieve a new consolidation for the rest of the day, we are talking 1.1227. From there a move to a Zero likely with a new range by then. After, a Wave 3 perhaps to +300. At least, that is my thinking for now.
…from here on an unreleased blog entry that would had been called
Music To My Fears
I was thinking about Allister Brimble the other day. What was Mr. Project X Superfrog up to these days?
I found All Good Things on his YouTube as expected.
A lot of my CDs were brought over from the Philippines. On top there were a couple of Scopece CDs (Fox Hunting, Any Time). I was wondering for a minute, who even knows his name?
I did not even remember the brown Color Theory T-shirt that was in the laundry. Must had come with the first purchase of 7 or so CDs from Brian Hazard. How is your Napster Ponytail hanging on Huntington Beach, buddy?
By now I shared finding the consolidation mean, my percentage tool w/ labels and some of the things that seemed recurring as well as the static range made up of just shy of 2x fluctuation maximums from the 50 line.
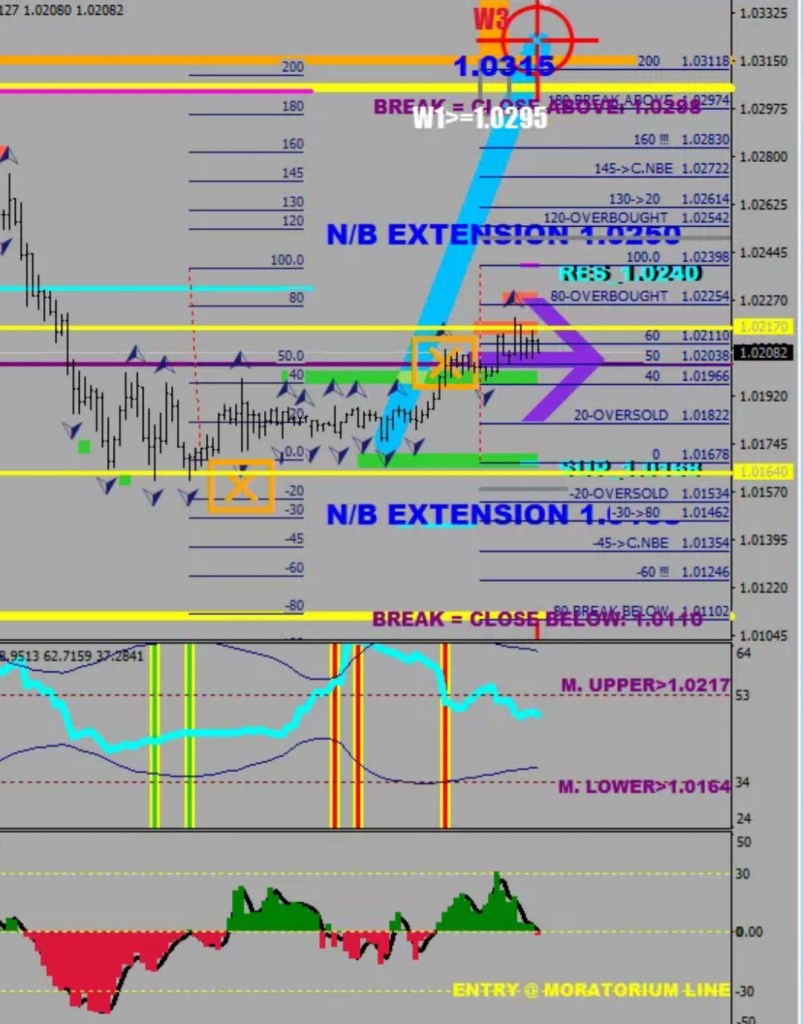
You may be tired of this image, but oh, it managed to capture so much.
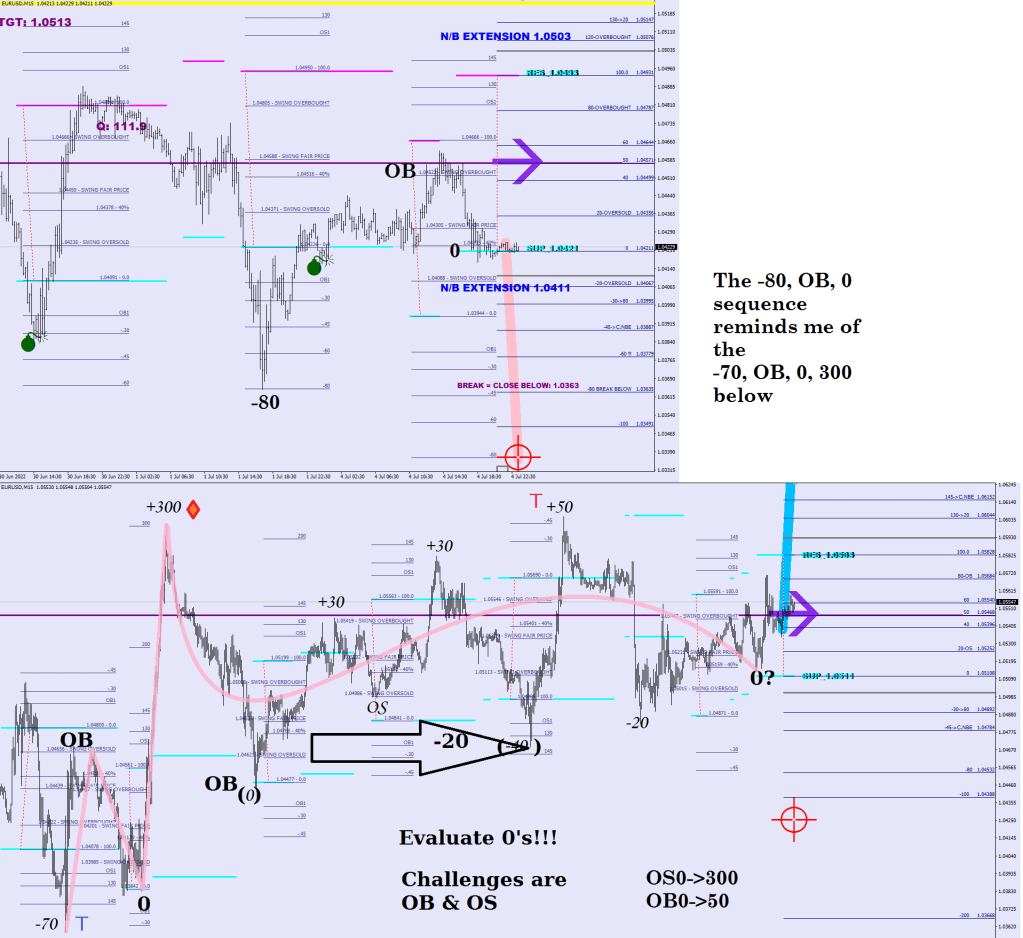
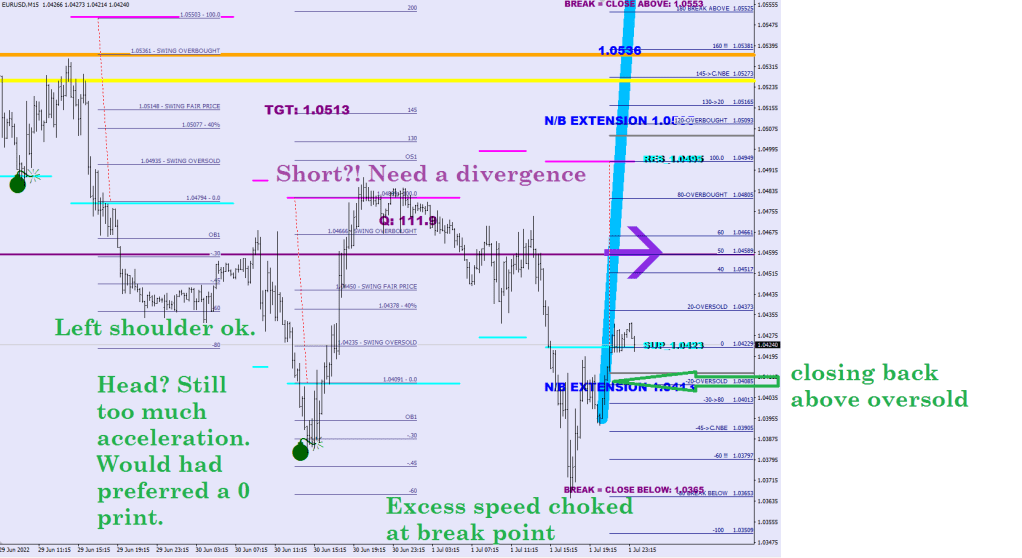
300 was followed by a 0 print at the other end.
The recent -100 went for the opposite 0: +100.
Price went below the cyan 0 line by almost 100, amd the zero (hard to see as it is covered out by the yellow money flow displacement) was a magenta line in ecistence briefly – imagine it opposite the interrupted cyan line.
Conclusion: 0 seeks 0.
Next up -30 on a future range, then equate at out of oversold and sell more at overbought (80) until a felft shoulder print (45-70%) before the last move down settling on a 0.
If the head itself overshoots the 0 by 20%, sell the next 0 again (100) for a divergent lower low.
Either this move mentioned above or the 0 after the LS would be the revolving door.
I should also mention that the -80 print earlier did not qualify for an LS as it was more than 70.
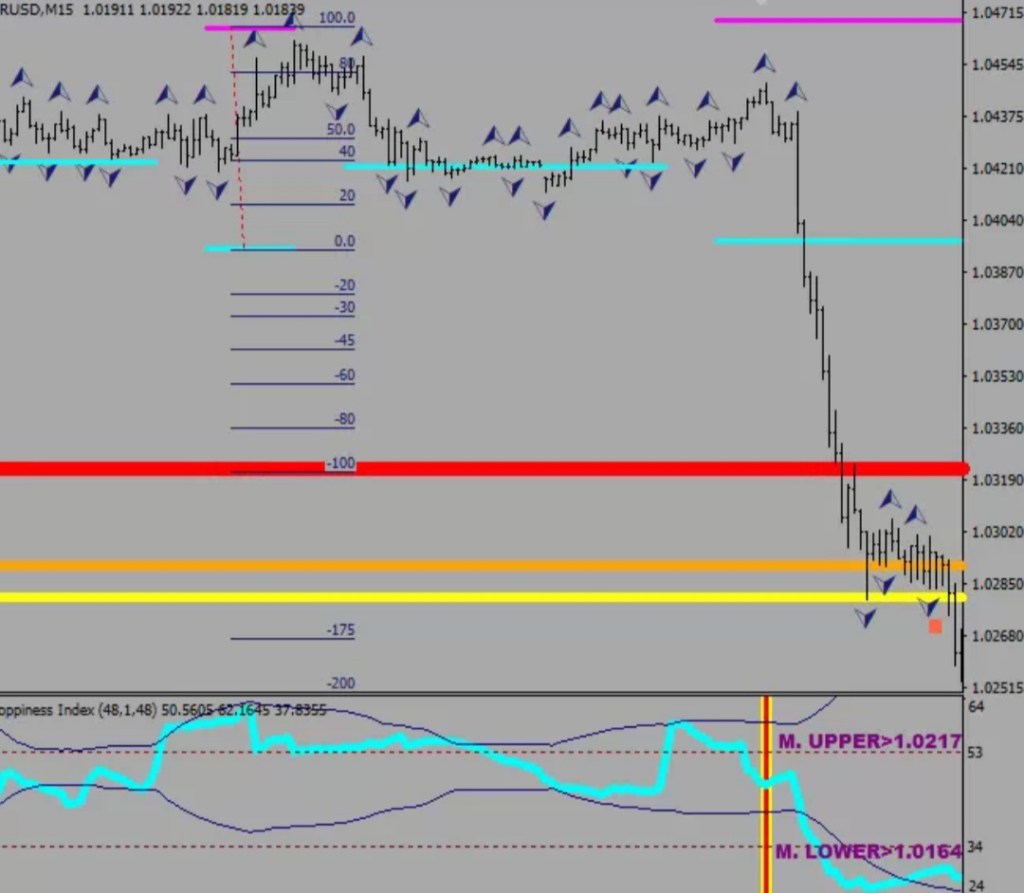
One more lesson: when the downside move overshot -200, price did not manage the +100, only got to 90 (deeply overbought).
The future is bright right before the last toll.
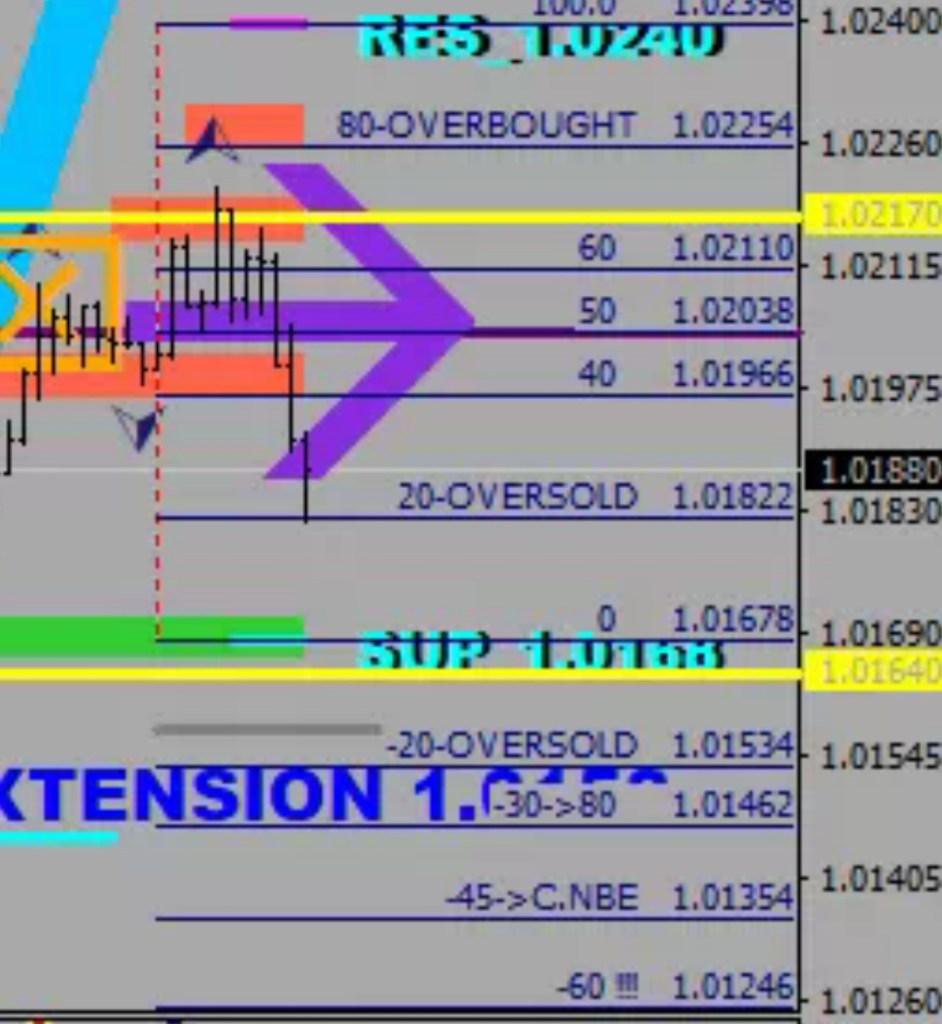
Price just bounced off the oversold. Should continue to at least -30, perhaps beyond -45 (LS). A lower low regardless. Adding to shorts.
Since the parenting range is counted from 0 to 100, -200 is the equivalent of +300 for distance.
We can say that they both managed to get to the “300” thanks to the volatility that was available.
The initial move – due to its velocity – made projections for itself and already filled the first one.
In terms of what should happen now, the ideas derived from the prior example are as follows:
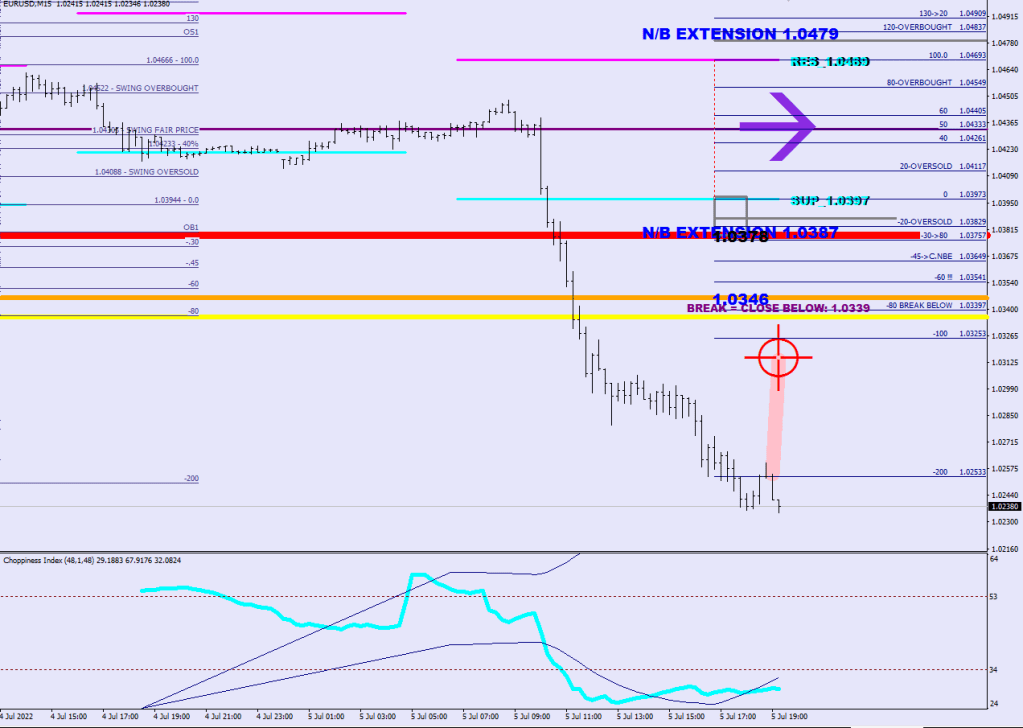
You should see a strong counter move that would not stop until the 15-minute 48-sample CI is back above 53 – and even then it would likely go to the future opposite “Zero” line which is going to be 36 pips higher than the consolidation mean itself. Time to find some available Choppiness indicator.
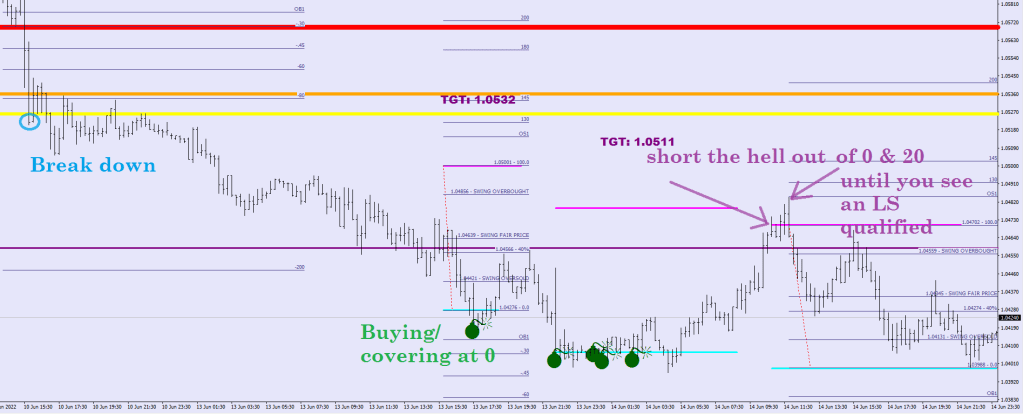
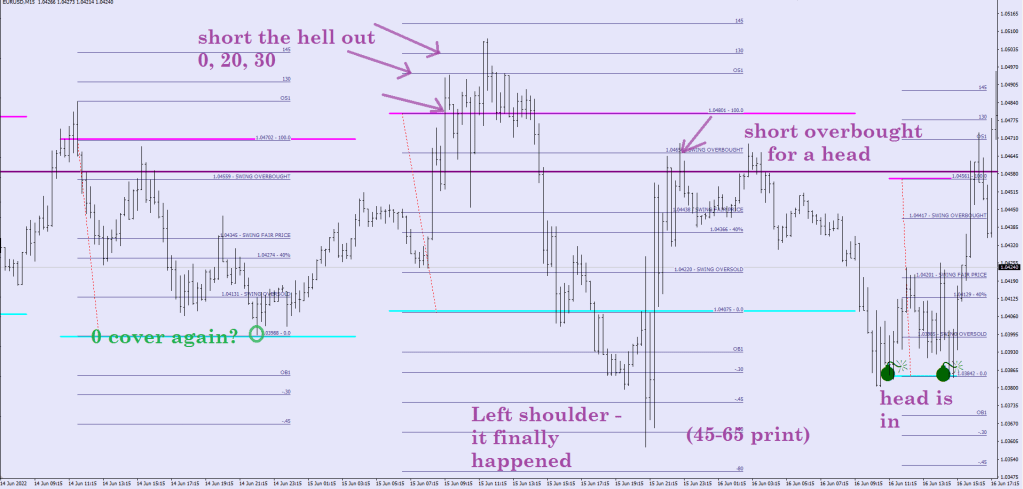
From there would come the next leg down and – see the bottom of the first image again, you should see up to 4 different legs down, one or two reaching to 30% on the opposite end, one making a left shoulder by achieving 45-65% and finally the touch of the Zero on the lower end would mean the head / longer term holding buy. The next left shoulder down may take out the low being made today. Just look at the bottom half of the first image and mirror everything.
It was certainly dumb of me thinking that the trendline made by three recent daily lows was anything more than a setup.
Unrelenting hammering at the Guard Rail was not going to let price to return to the mean.
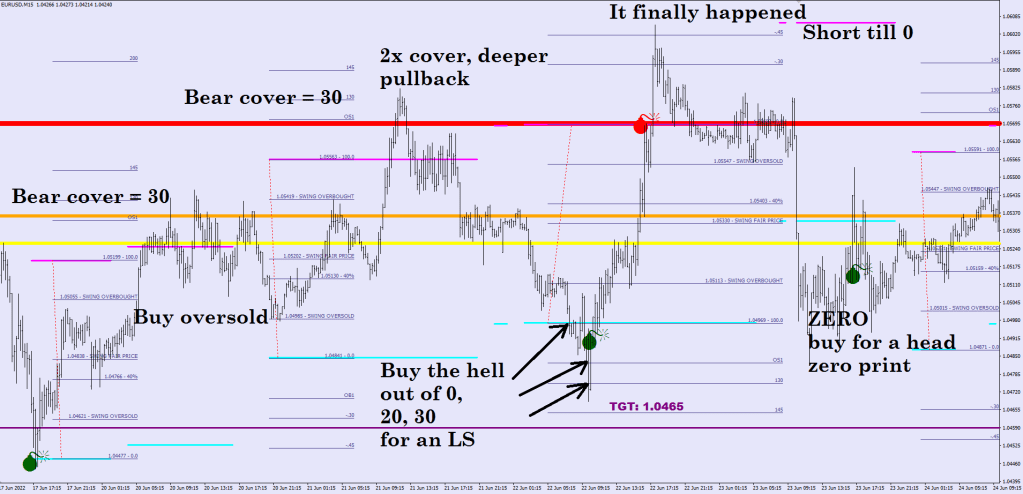
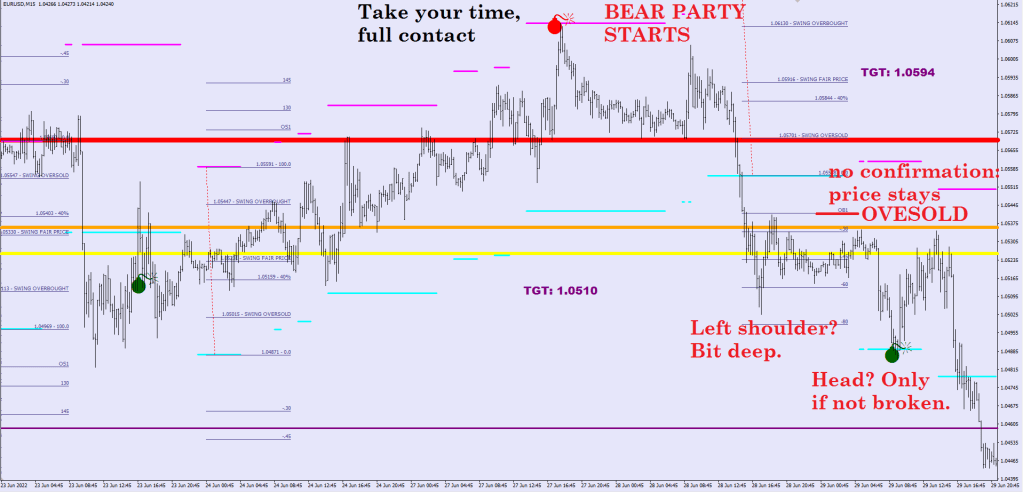
It would be normal to think that a head has to qualify for a turn, but what I’m finding here is that not only the left shoulder has to precede the head, but it too has to be right and it is rather hard for it to qualify.
This is all the data I can get buffered in with 15 min / MT4.
Now we need to see a head and shoulder in reversed order on the top
No rush.
The filp.
Tezro elemento after the head print is the confirmation.Quattro componento is inertia.Bear Party is over for now. Time to fly.
So yeah, there was that trendline, but let’s not start with that.
What happened here?
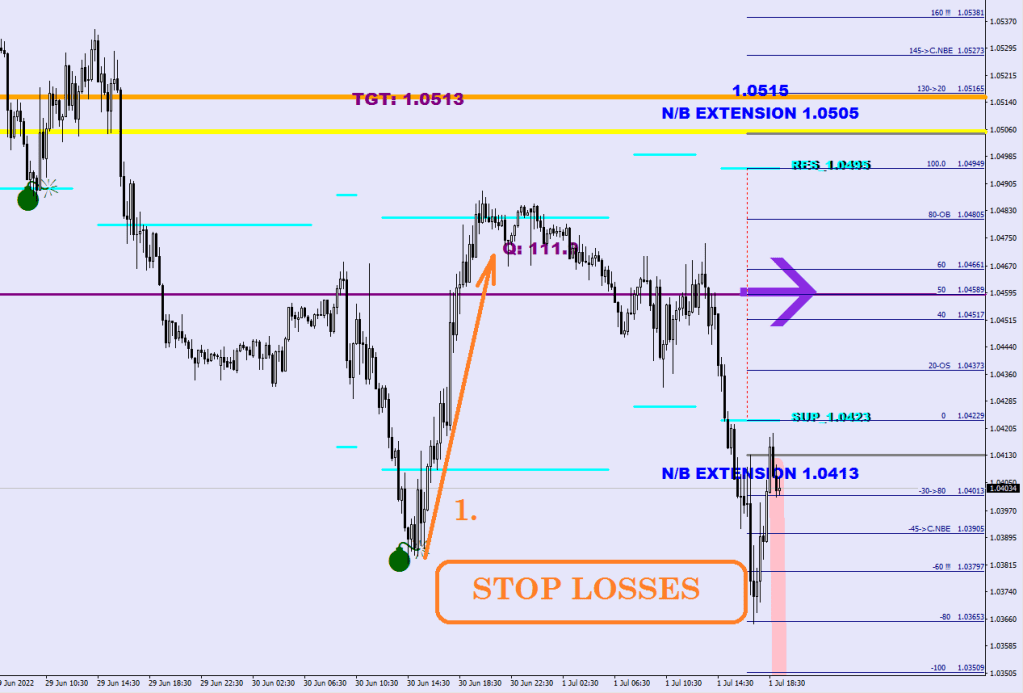
Number 1: institutions tip their hands: price moves very quickly due to high volume buying.
When large quantities are needed, they must buy on separate occasions: not to move price too far too fast, as that would be detrimental to the average cost, but also due to low liquidity: there aren’t enough contracts on offer.
So they wait for the price to fall back, they are keep on buying at market, but even that isn’t reaching the volume they had in mind. So they are going after all the pending break out orders and stop losses below the last swing low. The retail’s stop losses are gonna be within 15 pips likely.
This is not stop hunting, but a last resort of desperation to accumulate enough longs that they would get to hand back out on the way to 1.0720.
Now you can kind of picture how a lot of the 5th waves are made and why do they get 16 pips further than the last wave.
I have the right metrics for spotting a left shoulder, a head, a way of anticipating the end of the divergence under development and it is time for the definitions.
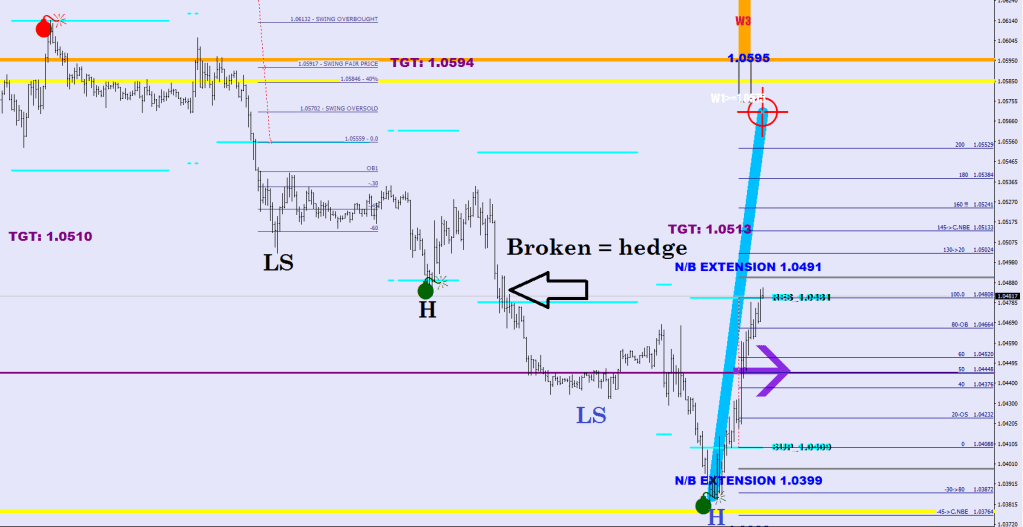
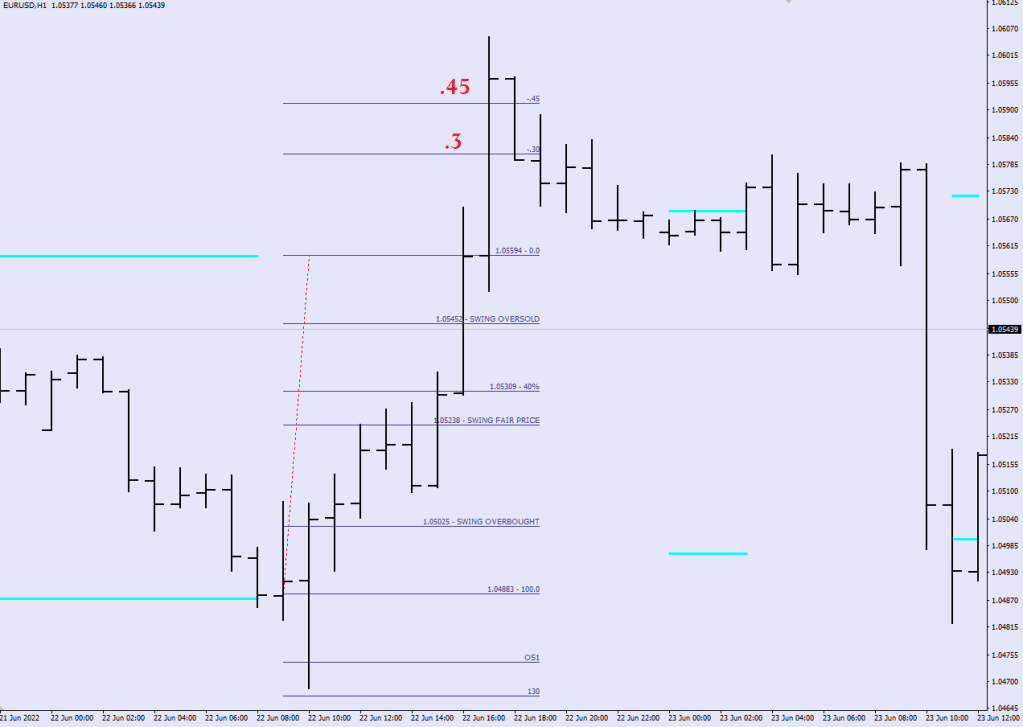
A left shoulder achieves a 45%-65% gain of extra distance beyond the parenting range.
A head fails to achieve what the left shoulder had managed to do. It is unable to get away from the current patenting range to the extent that the left shoulder could, thus setting up an end of impulse wave with a reversal divergence.
If a head gets violated more than 5 hours down the road, that is a break out and needs to be played/hedged.
A head would manage at least a zero print (and nominally would get further than the left shoulder, but not relative to the current parenting range), but would fall shy from the previous distance achieved by at least 25%.
What is necessary for the head is Full Contact. I think this much I can remember.
The move ain’t over till it’s over. Catching the head is the optimal entry. A rising/falling wedge has a sequence of a shoulder and a head.
I’m feeling slightly sad that I managed to get myself fully trapped by having no canes of knowledge, but constant uncertainties blowing at my head from a high speed fan.
Knowing where you need to hedge and until when makes a world of difference.
As for this counter trend move down was larger (230 pips) than the most recent largest (around 217 pips) this does not mean that I should be throwing away all of my ideas about the real direction.
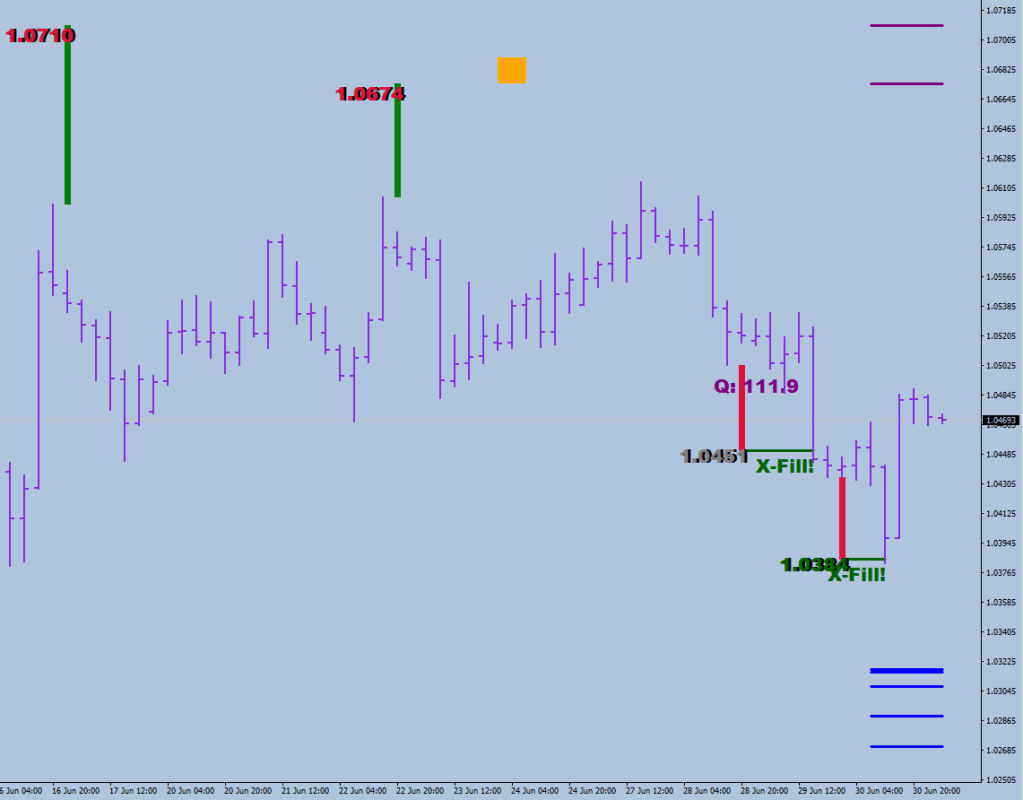
Projected distance extension fill
No, not snail shells.
Now, who is singing songs in my head that I have never heard before?
OK. Grab some adult beverage & let’s go. We’ll be looking at counter moves and terminal waves.
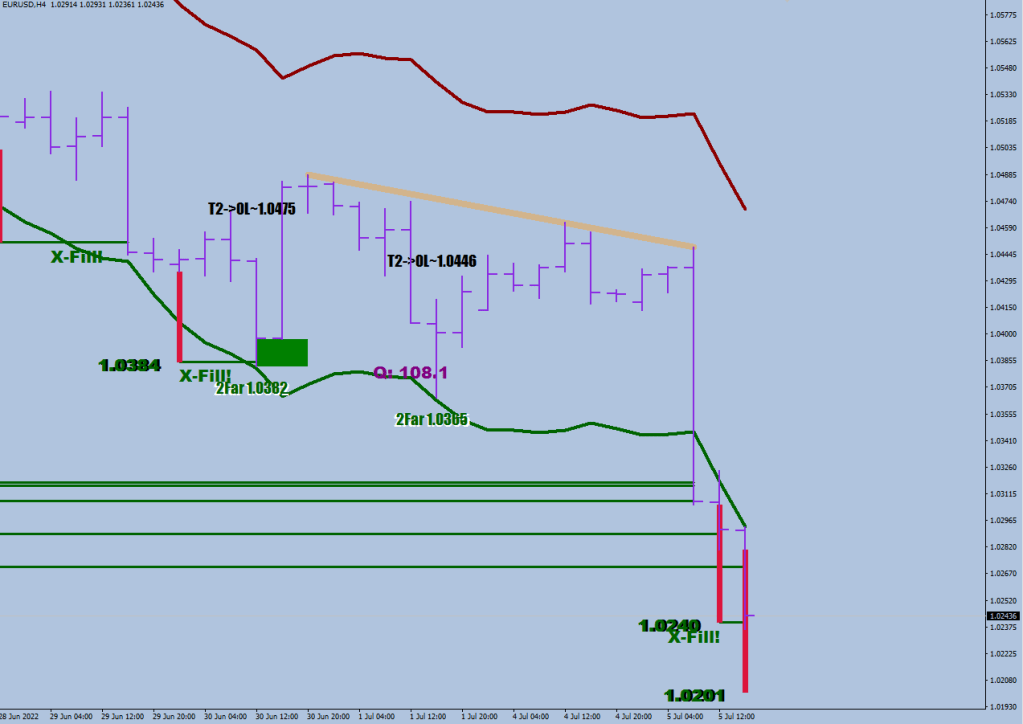
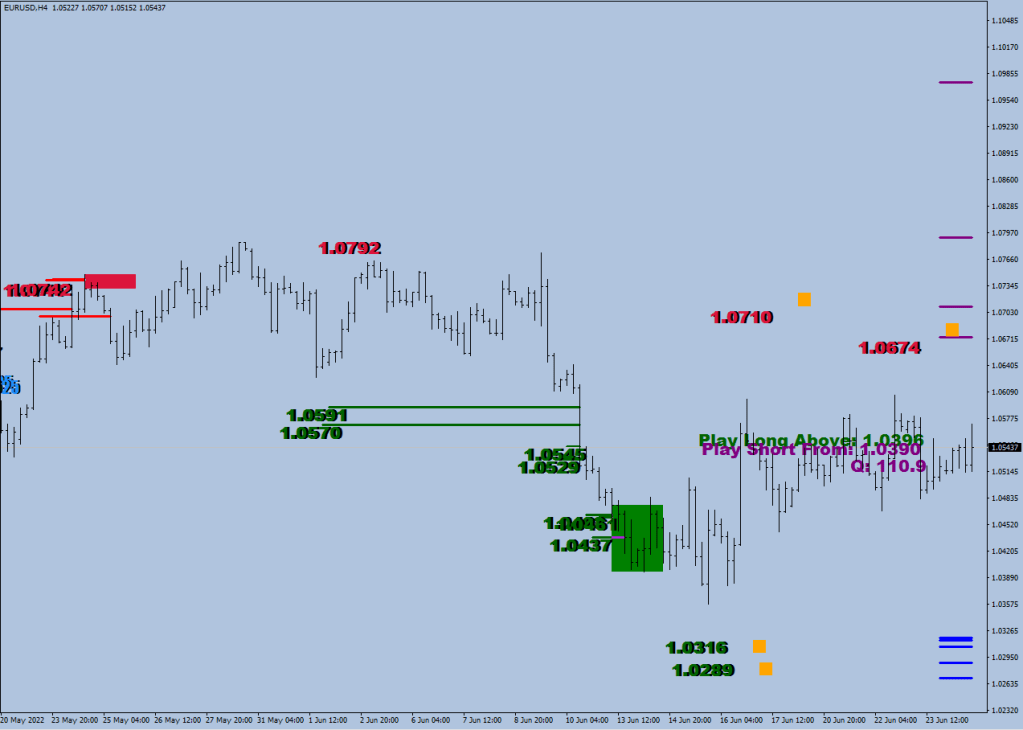
If you look at the big picture, the trend is up – despite of the 170-pip sell-off in the last 2 days.
See, the volume & momentum is still green, because the 18-sample stochastic hasn’t been taken to the extreme, because the pro volume did not happen with an RSI2 below 40, and the RSI2 was only temporarily in the “Enough To Turn” field yesterday, but not by the settlement. Kudos for the bears to be able to capitalize in on this window of opportunity in a big way.
With all this said, there are counter moves in every directional move, as you can see by the white highlights below:
These moves in case of this trading instrument cap out around 210-220 pips, but the 90, 130 and 170 numbers I picked due to wanting to get a fill, and the spacing is an intentional 40 pips. With me so far?
Normally after the green laser beam (first image) price would conquer the 20 SMA within 3 days and would challenge the E44 in 6. After 7 the move may be considered long in the tooth. Of course this run up felt like a not normal, lackluster rally.
Now, the following things we are learning together.
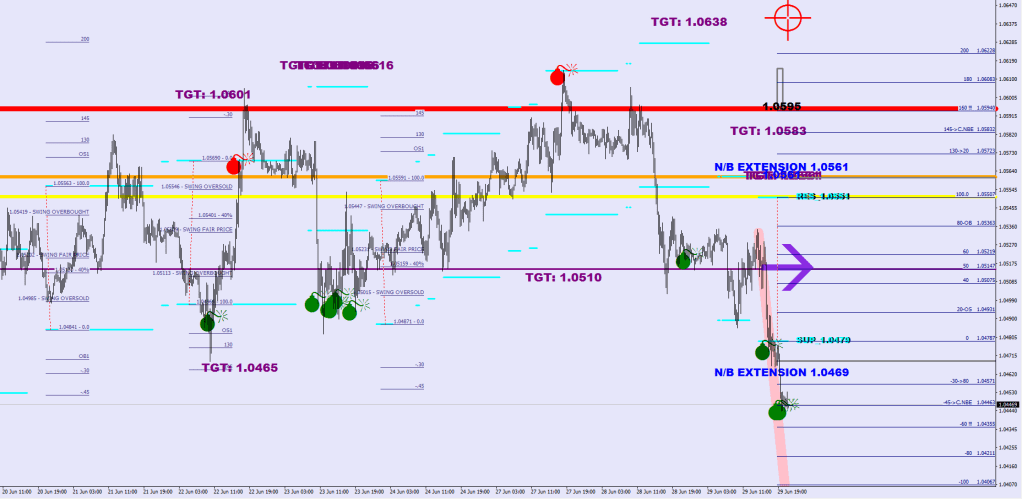
The cyan lines are the “Zero to Zero” range around the last consolidation weight.
After the “end of wave” print of 45, there was a back test of this level arriving at a zero print. This we’re going to call “taking a stand”.
That -45 block could be also read as a Zero to No Break Extension (10 pips lower) if we are using the previous range’s data.
What we are trying to figure out here is this flat-top-drop (trademark of Oscar Carbonara) of 3 domes at 1.06 why and how are still calling for a house on the peak.
As we gathered, the move can still be a counter move within the wave for a bit longer. What went wrong on the way down at the potential terminal area of growth (50% extra) is that the price went extra strong and violated the 60% or the 61.8314432% if you have this kind of a fetish.
As you can spot on the first image, the 170 pips discount comes in at 1.0444 and we are yo-yoing around the terminal 50%. I’m thinking the continuation divergence (higher low) is very close, especially if there would be no closes below the 60%.
This is an oversold, but not embedded weekly bear market. Oversold by itself does not attract new money. Pros target either the daily Bollinger Band or a Weekly Window Envelope to exit (whichever is more reasonable.)
No, I did not turn into Schindler’s fundamentalist all of a sudden, but there is something to be said here about them central plonkers.
The Spainard CP-Lie came in at 10.2 today.
This would leave the ECB with having to start tightening agressively.
Although the FED is already after a .25, a .5 and a .75 hike, Europe is to start from a decades long stand still. And they would have to do it at least twice the pace of the FED. It is not the nominal rate that matters, but the rate of change. Do you really want to be short the Euro before it getting a horse shoe?
Straight outta Compton nowhere.
The sunset images I took at a summer Detasseling labor camp.channel target filled, bottom of channel made
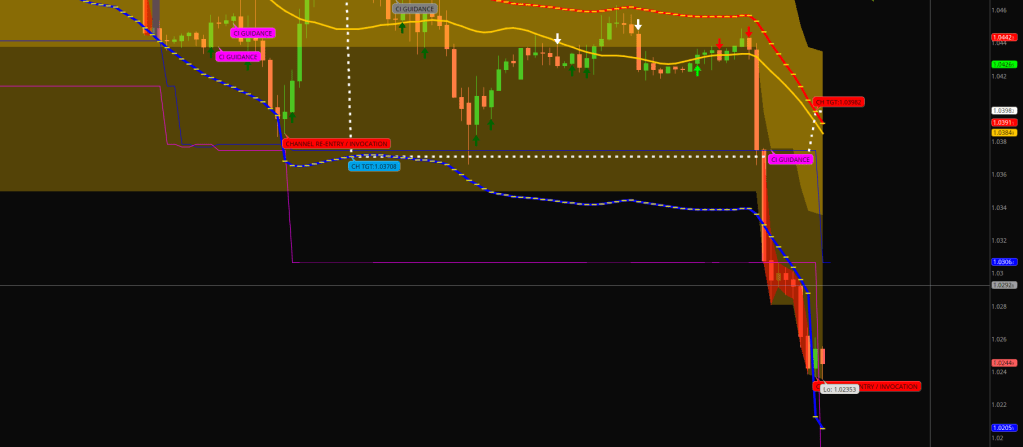
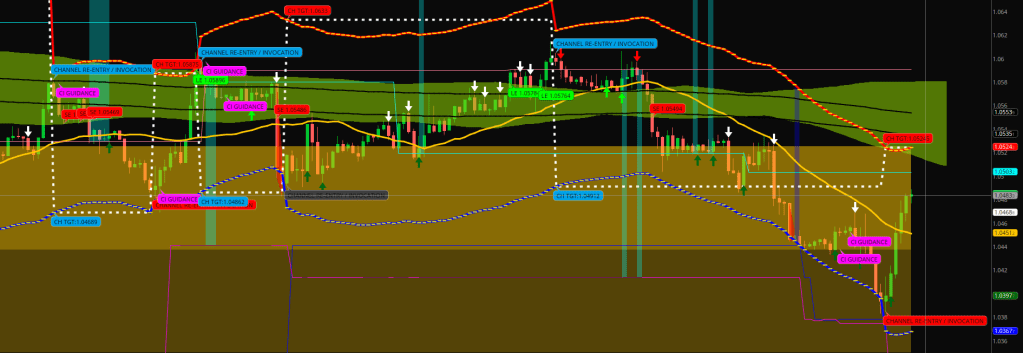
After Projected Distance, what use does my CI Moat Dynamic have in the current Bear Market?
How about helping to spot a lower high for an optimal daily entry?
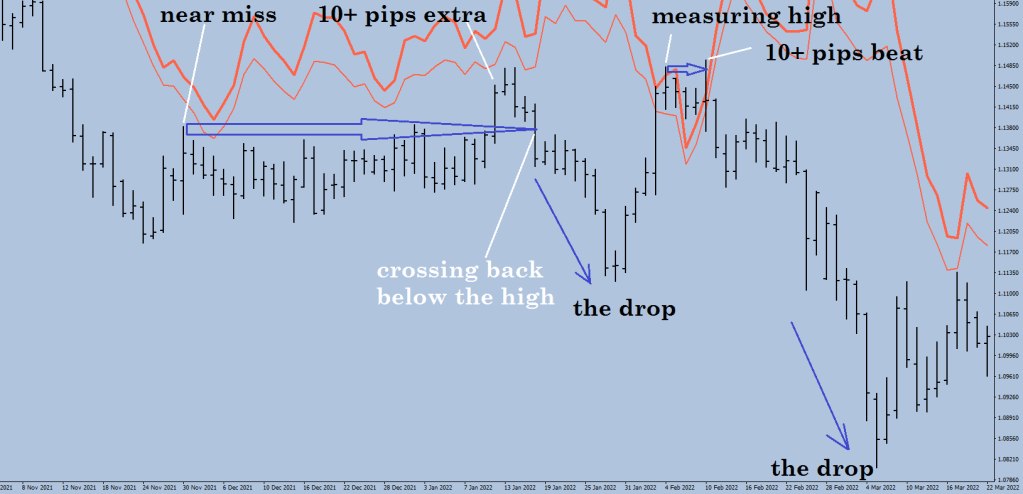
An image for warm-up.
The near miss took forever to be beaten and the drop wasn’t sensational either.
You get to label up the next one and take note of the higher low at the end.
I have nothing for sale any more. I closed my US dollar denominated account that was linked to the PayPal. Paying for this blog as long as I live. Never stumbled upon a meaningful collaboration.
I’m here to help you. I’m here to call you lazy, bigot religious fanatic.
The Peter-Noster is the concept of price stepping outside of the parenting range, that becomes the elevatror/building block and there would be new oversold and overbought levels in each direction i.e. at 120%, 180%, -20%, -80%, -120% etc.
The gray lines are the NO BREAK EXTENSION LEVELS, they would stop price in the wring direction, they are often seen at the very end of a Wave structure.
So, what is my problem with Fibonacci retracements?
There is nothing wrong with measuring things, there is nothing wrong with using percentages.
The problem is setting your mind on pseudo scientific things (meaningless fractions in this case) and attributing God-like status to them. This is a slippery slope and you should try to stay off of it, or you may end up believing in things like: God implanted dinosaur skeletons and fossils to challenge your faith & there was nothing before the creation. This type of behavior is always going to re-format the data to fit the narrative and there is simply nothing objective about that.
Change the settings on your scissor-tool to rational numbers before it’s too late.
My take on the subject of future growth that it is a non-quantifiable outburst with the aim of an extra 50%, but as a probability I would point to 45% of the parenting size to be achieved as a high likelihood, for this is what charts are suggesting me (projected distance), and 61.81394521% (aka the garden ratio) is some made up, idealistic crap.
Let’s try to appreciate what is happening here.
You need to see a divergent leg scoring 50%+ extra, but less than 80% for a swing to be an end of a corrective wave. Look at what happened every time when the red 50% extension line got hit.
Having discussed the 45% you may start to appreciate looking for this telltale of growth, an indication of an end of a divergent leg (referencing the parenting range as measuring leg). This is what you need, the exit, the end of the move for a rotation into the other direction.
The lines on the right hand side are 50% extension of qualified moves that were not filled yet.
Where are the market profile people wrong? Not understanding the relativity to the consolidation mean and calling both a success and an excess an excess. Well they are, but there is a major difference between the two. Final vs temporary.
Now, let’s do modular music today on this wide array of healing frequencies.
On the subject of Sound Therapy. Does this sound InZane?























 ForexFore - Internals, indicators, algorithmic trading