De Mora-Lisa

From the beginning of time, humanity had only one question: when is the future?

Ever since there’s been stock market, a second, less articulated mutation of the same virulent question was formed: Where does an impulse wave end?

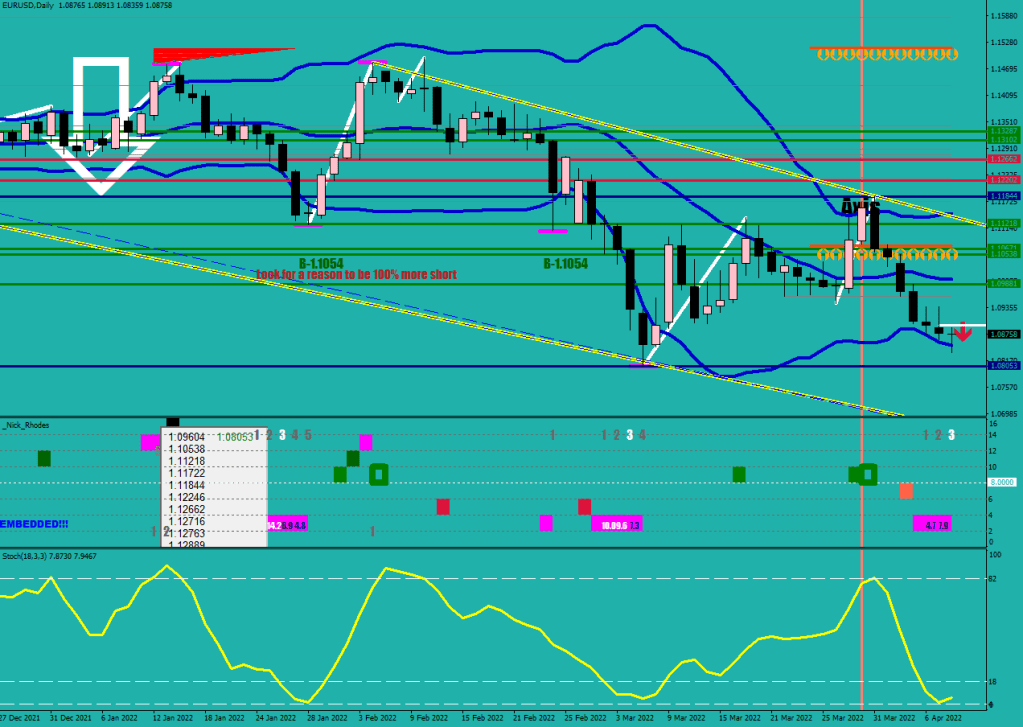
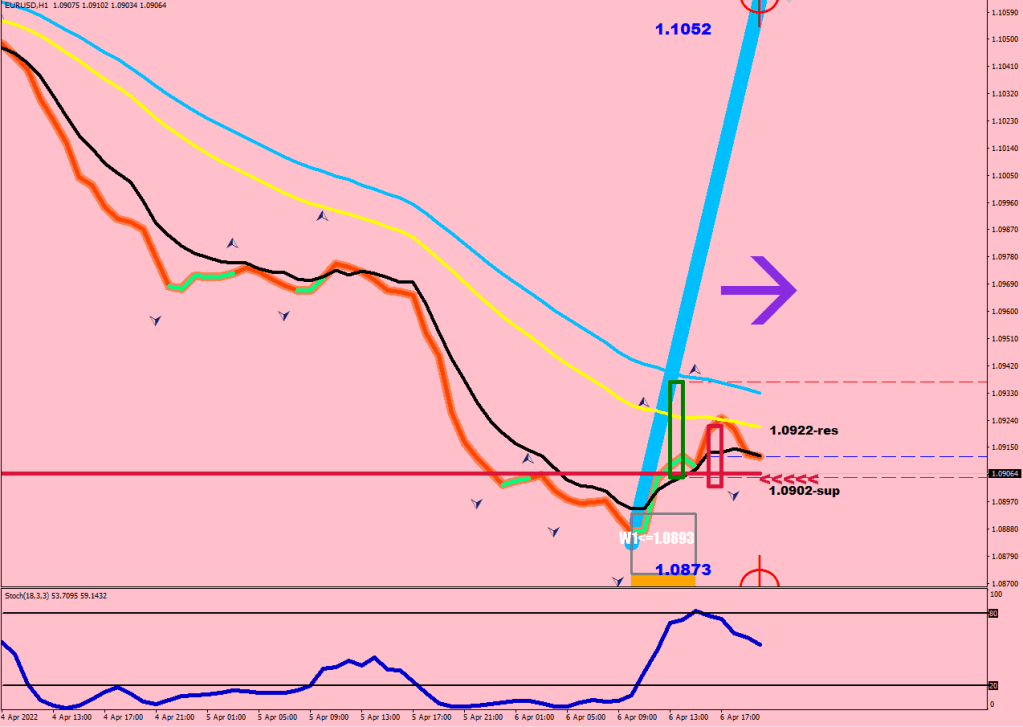
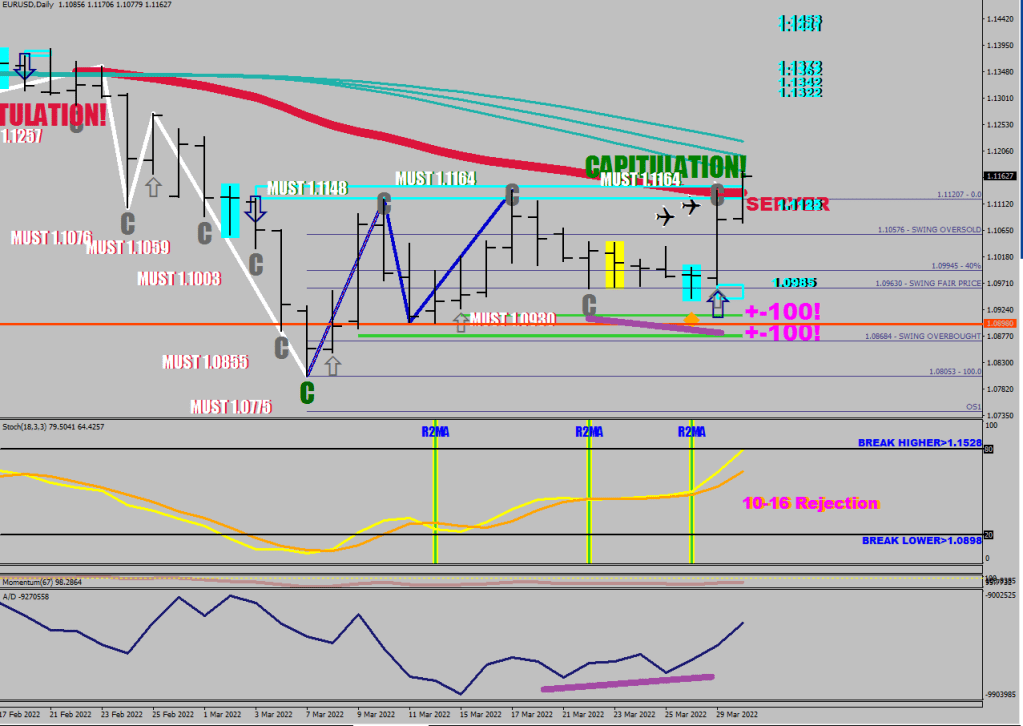
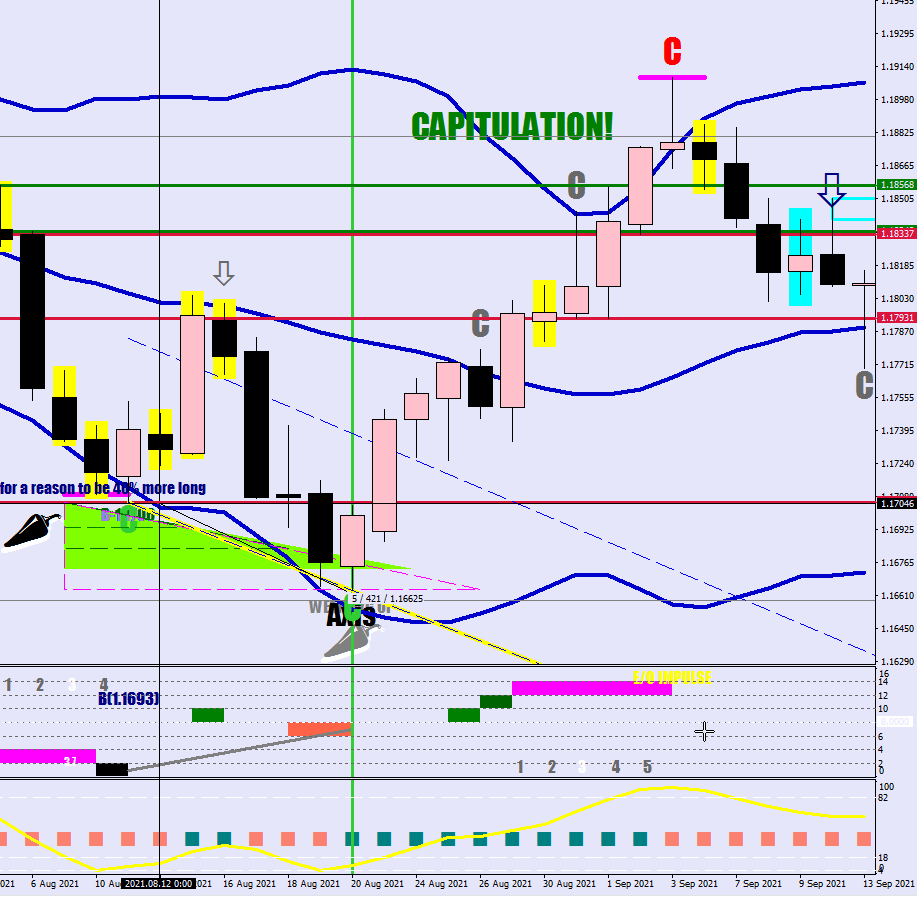
Let’s set the stage. Imagine it is last Friday, the market makes a cover low with optimal daily stochastic reading, and all is looking good for a corrective leg ending and a rally starting.

Green cover low got downgraded to lime cover low due to the next day’s muted accomplishment.

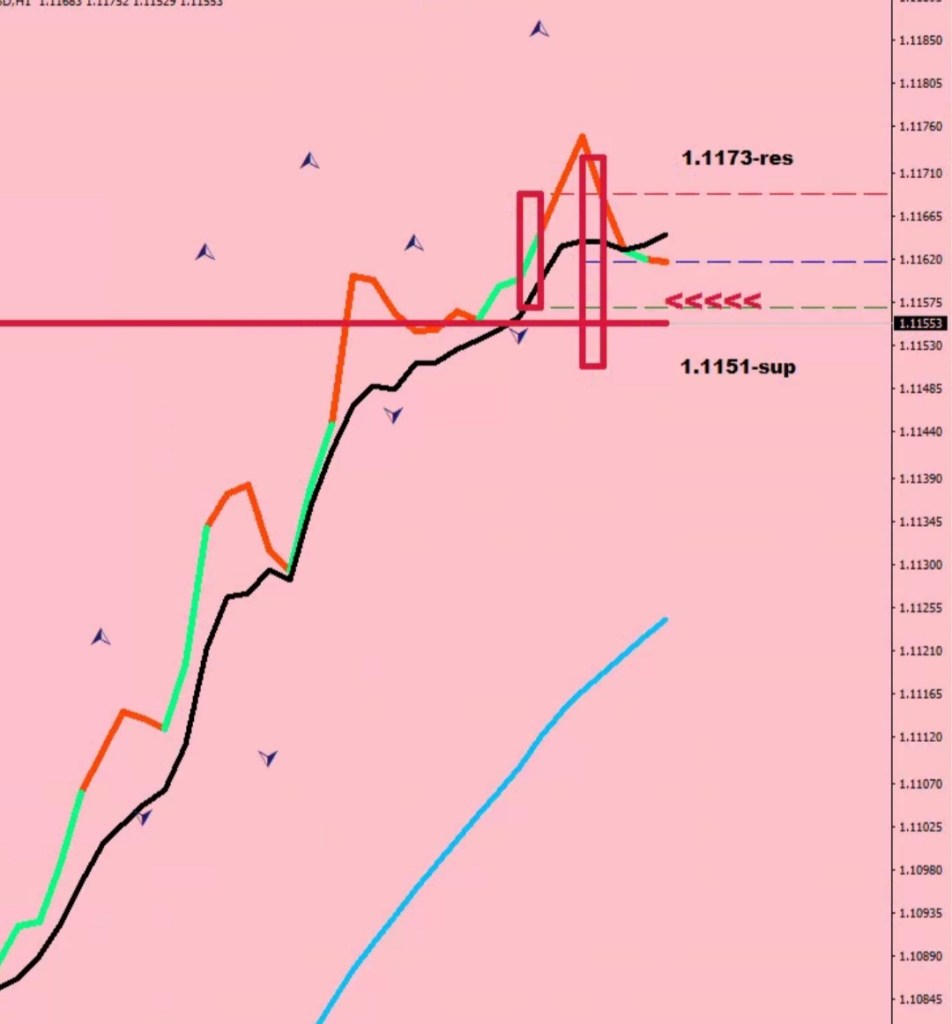
So market makers got creative. They wanted more longs on their books to be able to hand them out to the suckers on the way up, so they gapped the market up. Nothing too crazy, but was enough to make the weak hands part from their longs at a break even or worse. The upside got limited by these deeds: when the gap high was exceeded on the second up leg, the new low was already a secured prospect.

If you pay attention, although the resurrection candle came with a higher high and a higher low, it was unable to exceed the highs of the previous 2 candles.

With this fishy, meet my hook act they turned a corrective wave into an impulsive one with elusive ending summoned.

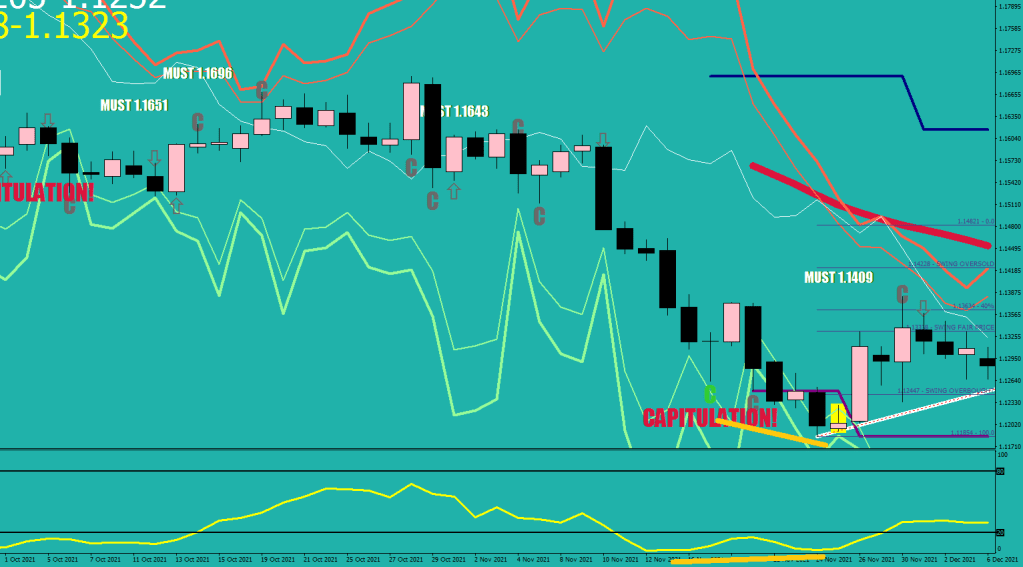
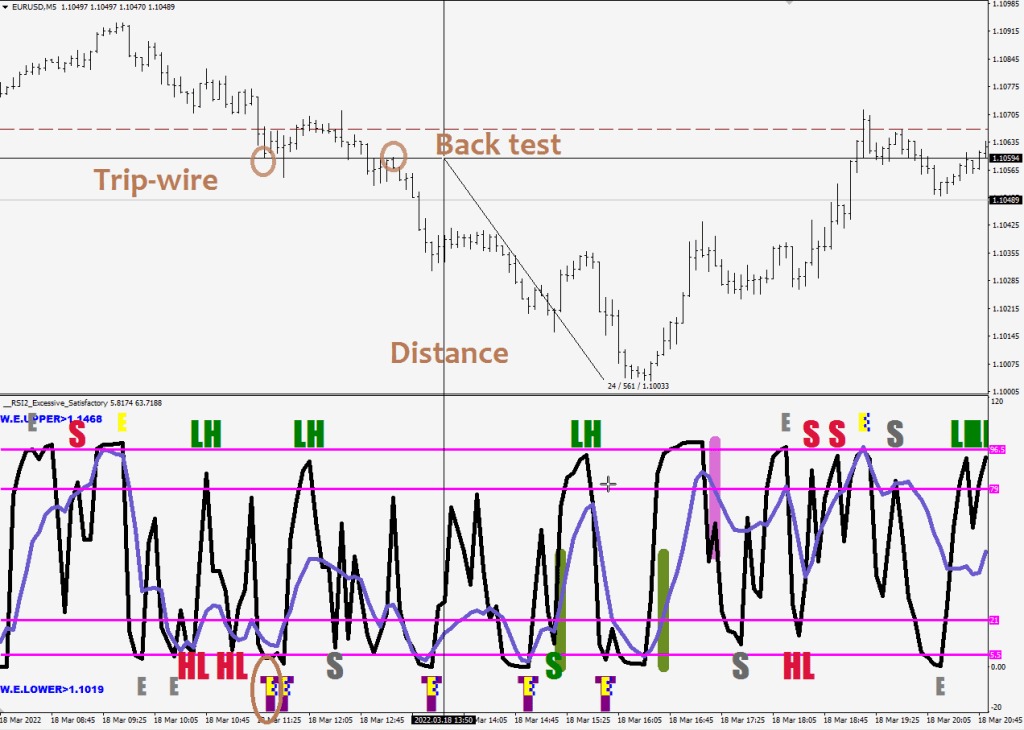
If you look at the previous divergent endings…

The market undercut the low by 56 pips 13 trading days later for a swing low.
The market undercut the lime cover low by 42 pips 7 trading days out. The upside from the first lime C was 202 pips.
The undercut of the lime cover low was 77 pips 5 trading days out. The total upside was 220 pips from the lime low, but it cost 41 trading days to get there.

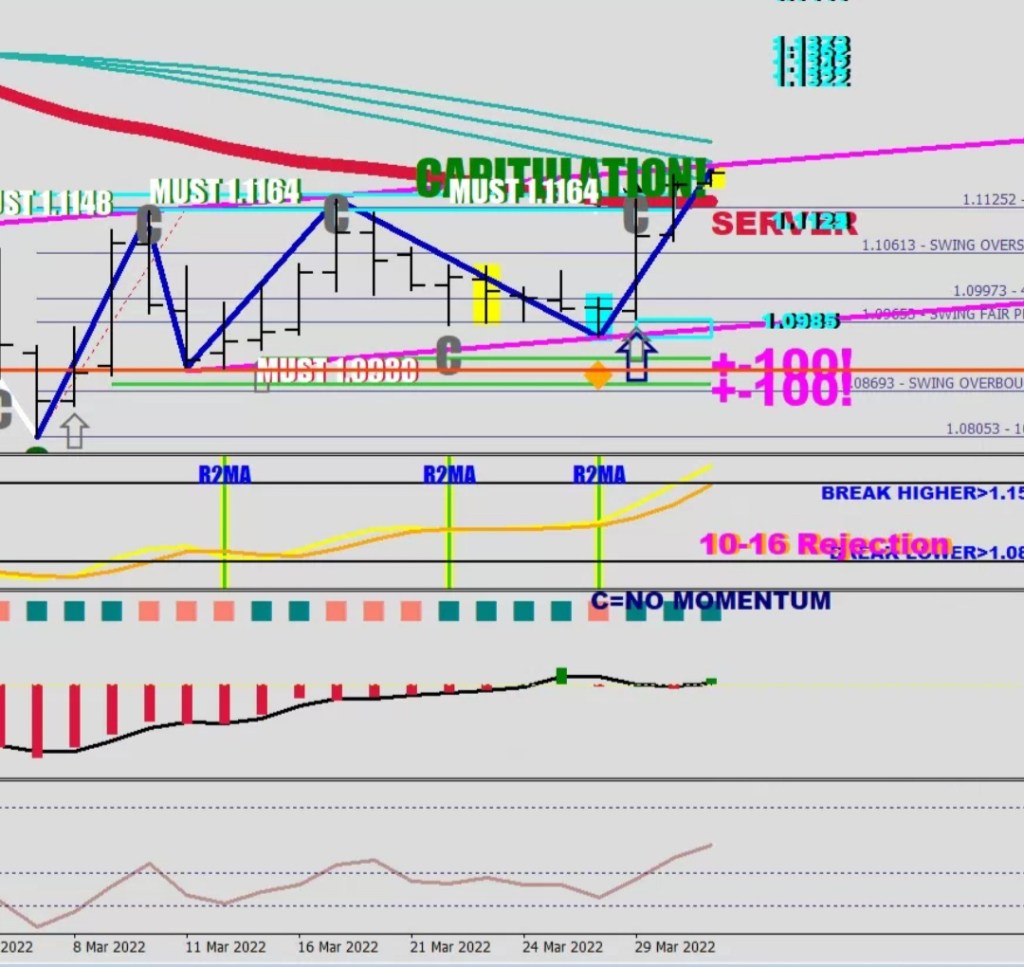
…what you would find is that the swing lows do not coincide with cover lows, they simply choke without further impetus and the move back up looks like a bloody mess dragging on seemingly forever and getting nowhere fast. Instead of a clear cut correction in the neighborhood of 250 pips, they end when the market becomes overbought enough (market makers managed to dump their longs) and the market is still within a hundred odd pips away from the swing low before starting the next dump and pump scheme.

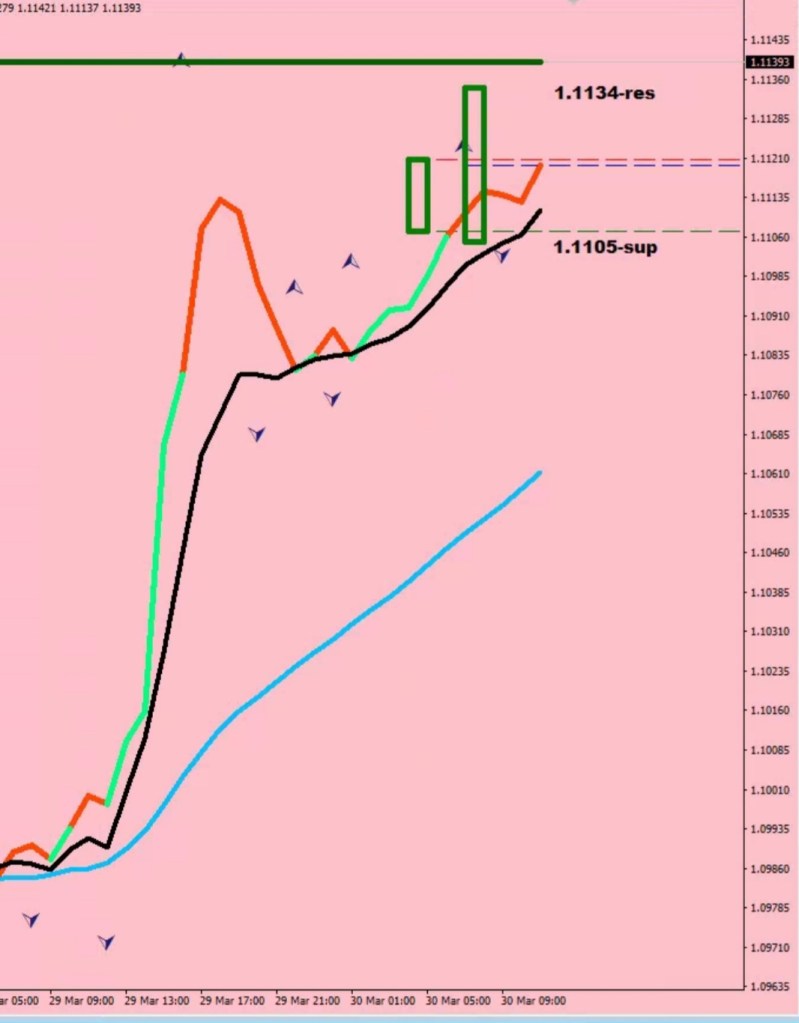
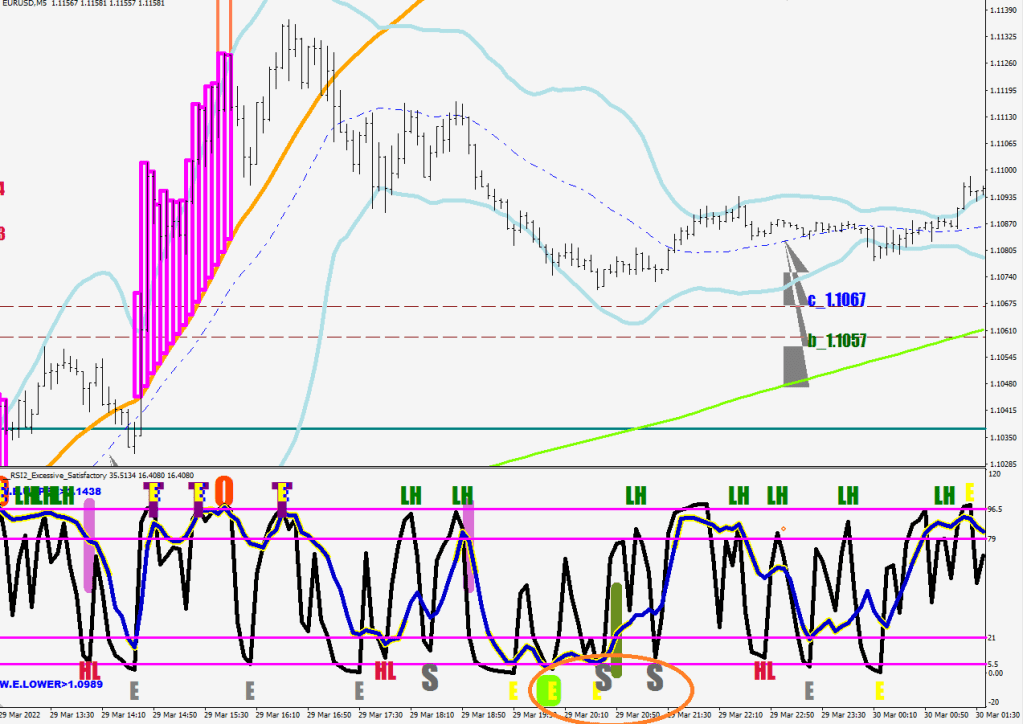
Gapping the market enforces transactions at the open with stops & target hit.

As you can see, after the divergence is set, the market is not going to drop much further, but whether it is going to be 2 or 77 pips more is impossible to say. If you go short, you are playing with fire, if you go long, you may be underwater for a week or more.

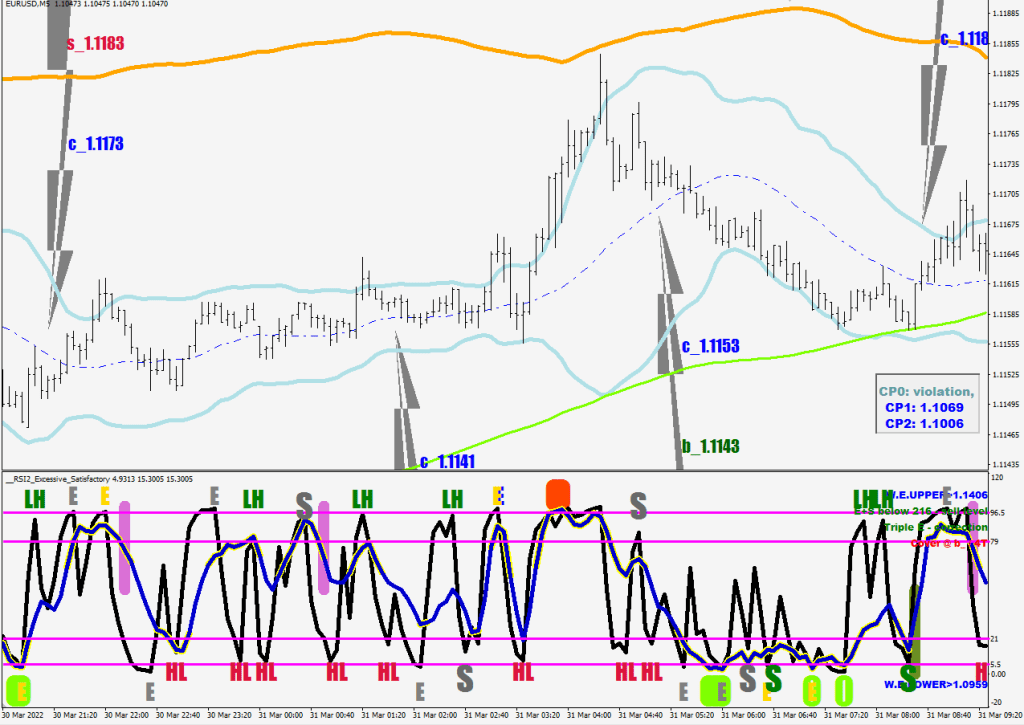
Nick Rhodes is an RSI2 based animal.

//////////////downside magenta   
   
   else if (RSI2[i]<5.3){
         score[i]=-3;
         ObjectCreate("Nick"+DoubleToStr(i), OBJ_RECTANGLE, indicator_window, Time[i], 4, Time[i+1], 2);
        ObjectSetInteger(0,"Nick"+DoubleToStr(i),OBJPROP_COLOR,clrMagenta);
        ObjectSet("Nick"+DoubleToStr(i),OBJPROP_WIDTH,8);
        
         if (Period()==1440 && iStochastic(symbol,0,18,3,3,0,0,0,i)<18 && score[i+1]==-3){
                     ObjectCreate("Penton"+DoubleToStr(i), OBJ_TEXT, indicator_window, Time[i+1], 3.5); 
                     if (iStochastic(symbol,0,18,3,3,0,0,0,i)<8.5 && iStochastic(symbol,0,18,3,3,0,0,0,i)>4)ObjectSetText("Penton"+DoubleToStr(i), "      "+DoubleToString(iStochastic(symbol,0,18,3,3,0,0,0,i),1), 8, "Impact", MidnightBlue);  
                     else ObjectSetText("Penton"+DoubleToStr(i), "      "+DoubleToString(iStochastic(symbol,0,18,3,3,0,0,0,i),1), 8, "Impact", White);  
                 }
        
        if (i>0 && RSI2[i]<2 && RSI2[i-1]>5){
          ObjectCreate("Nickergence"+i,OBJ_TREND,0,Time[i+1],Low[i],Time[i-1],Low[i]);
                 ObjectSetInteger(0,"Nickergence"+i,OBJPROP_RAY_RIGHT,false);
                 ObjectSet("Nickergence"+i,OBJPROP_COLOR,clrMagenta);
                 ObjectSet("Nickergence"+i,OBJPROP_WIDTH,5); 
                 ObjectSet("Nickergence"+i,OBJPROP_BACK,1);

Trading is just an illusion. I just showed you an example of turning a corrective wave into an impulsive by the simple act of rigging. Good thing no one’s ever asking the question: what is moving the market when there are no transactions being made?

Fundamentals must be the most exact measurement of value then. They can even make the price gap! George Schwartz Soros and his reflexivity tss! Go fundees!

Think twice, do you wanna be a Kennedy or a Fundamental?

Is the fundamentalist a form of a mentalist?

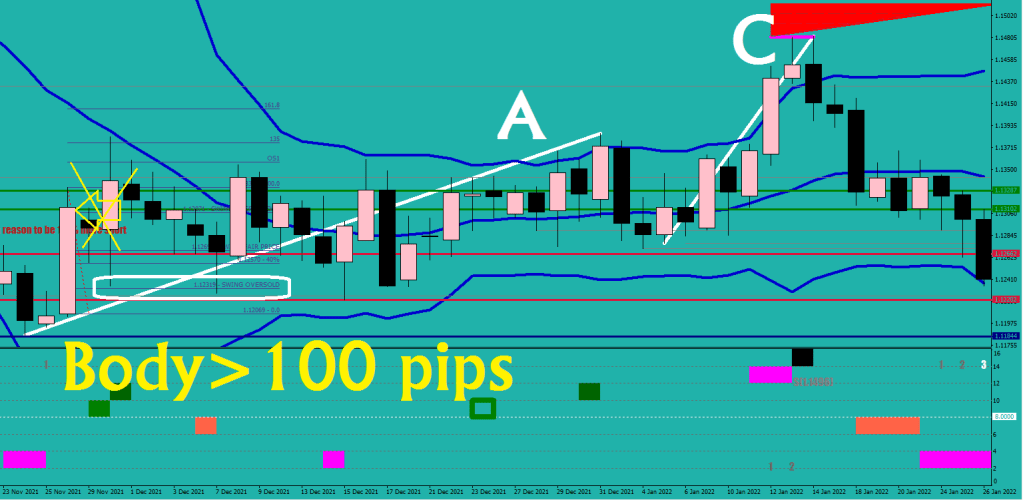
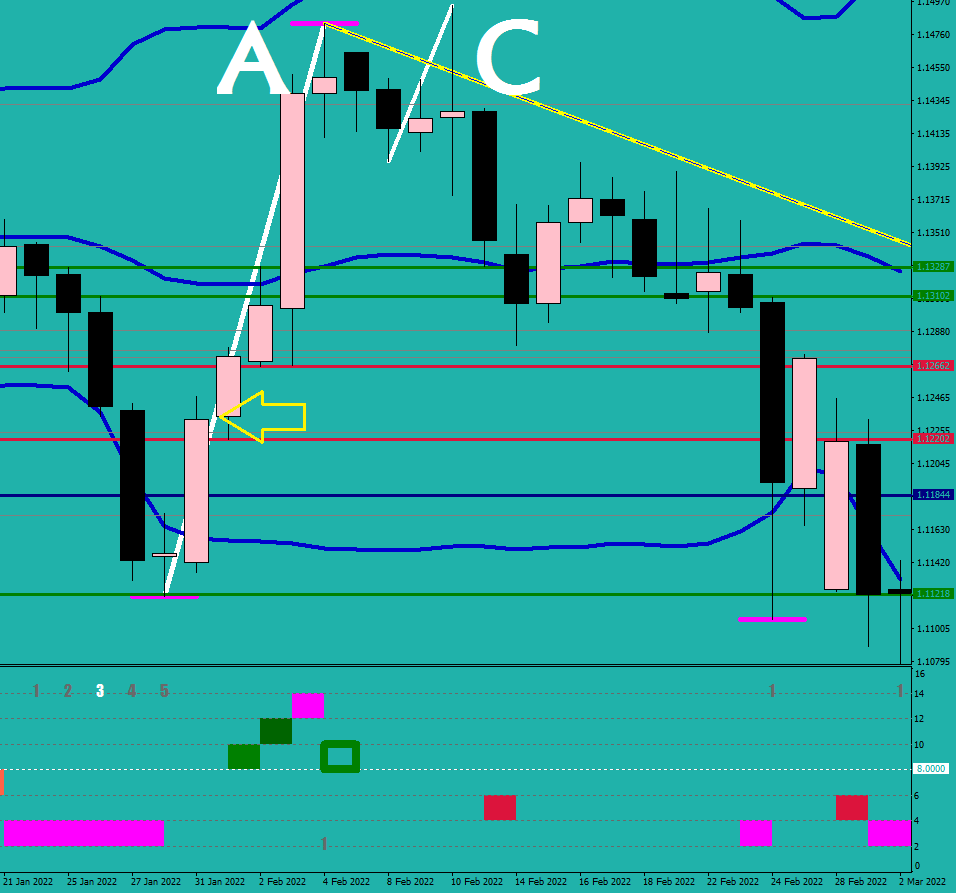
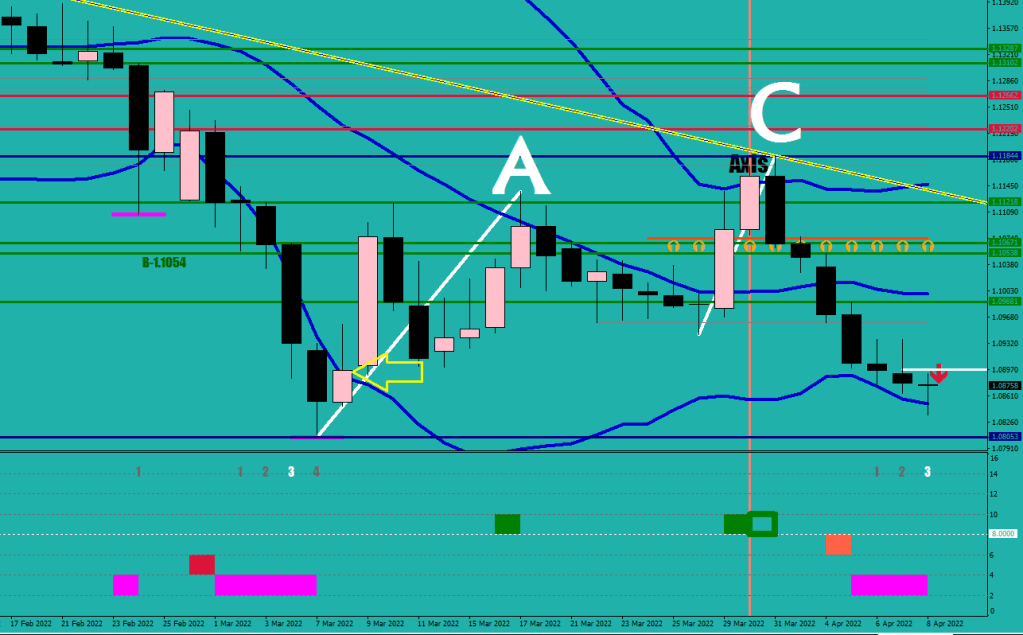
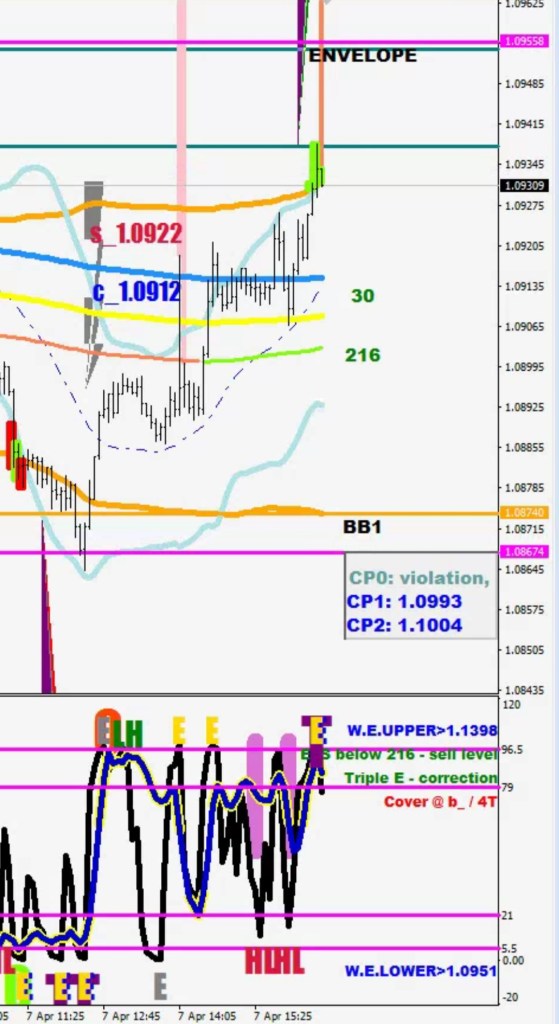
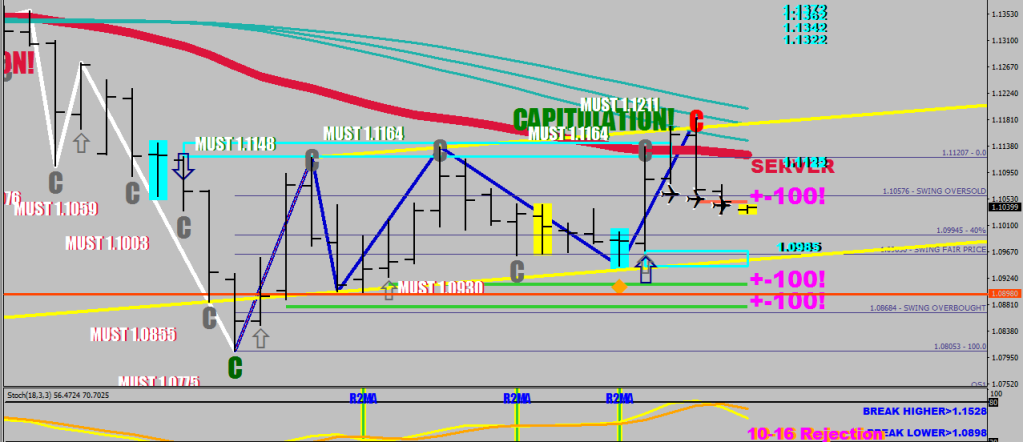
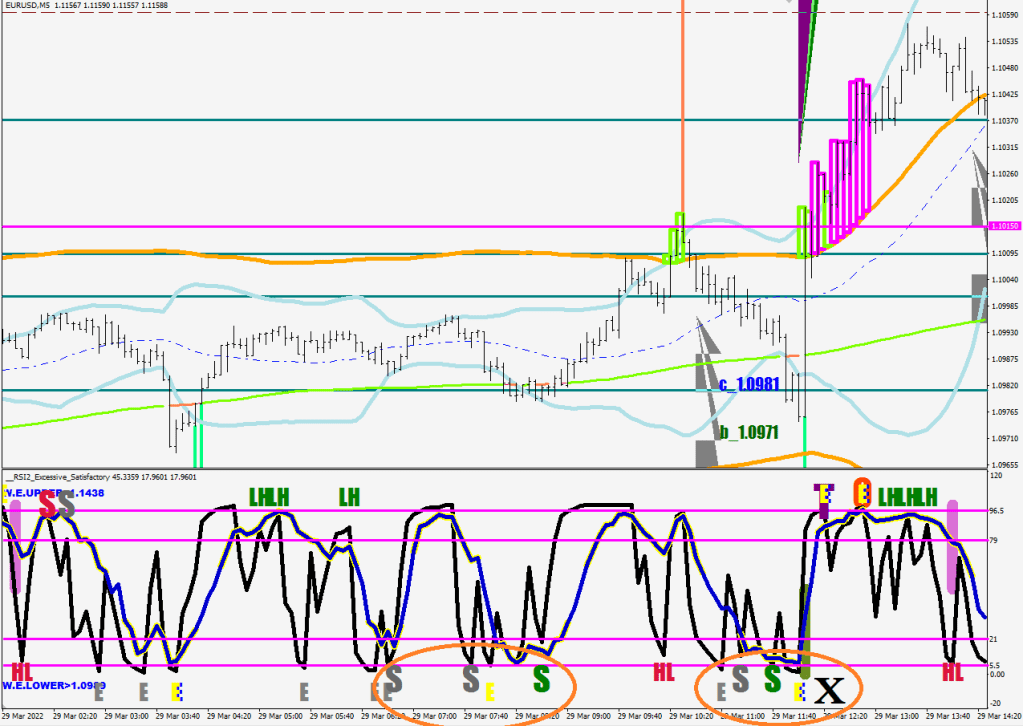
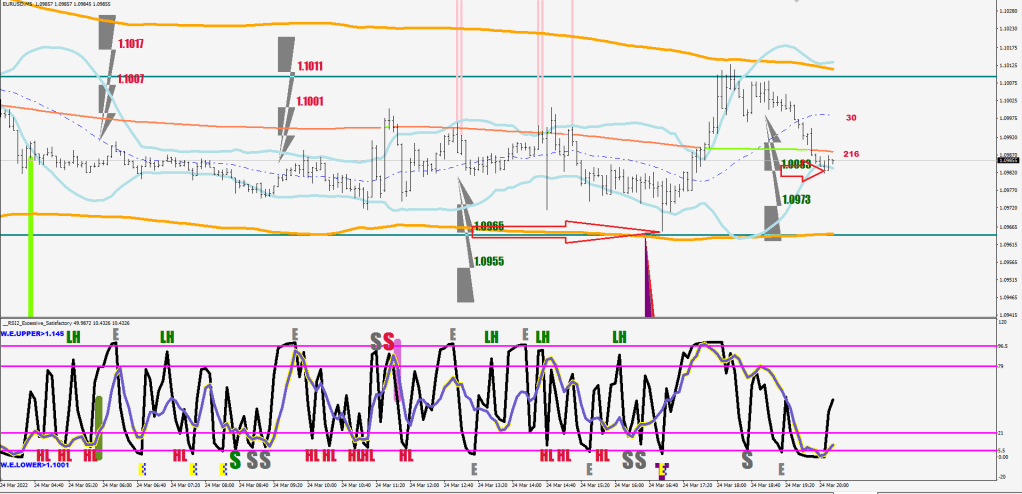
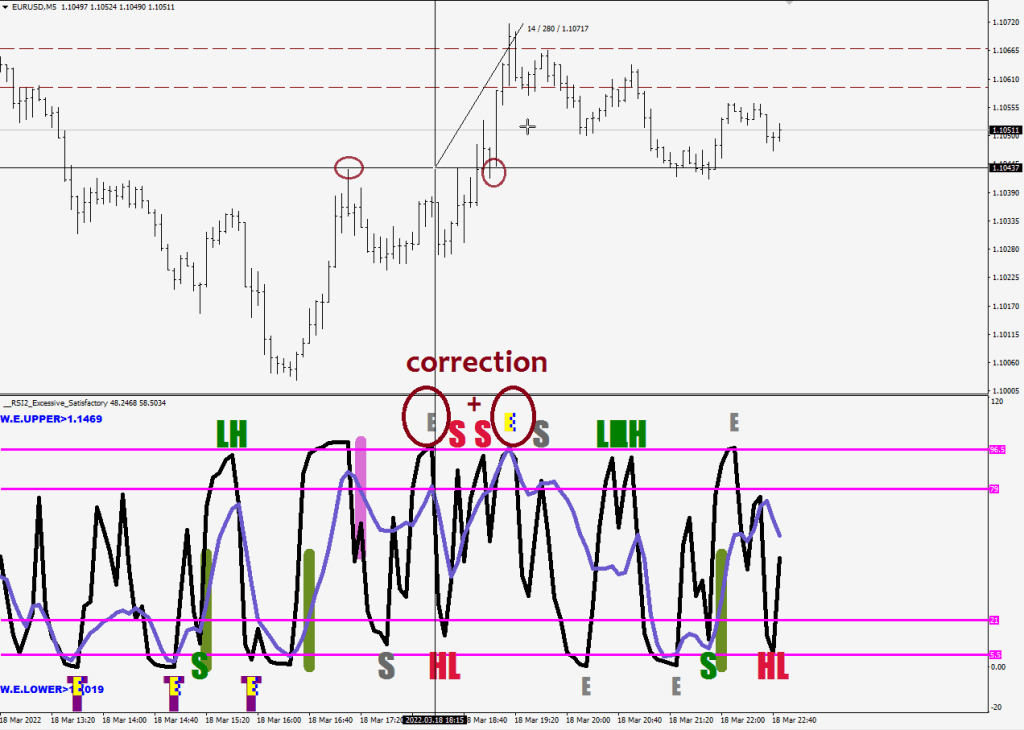
Here’s an E.W. dilemma for you. Without indicators, this move up looks like an ABC.

With indicators, you can see that the stochastic reading showed excess 3 separate times.

Was this 3 or 5 waves up?

W-wait a minute!

Us3: market makers, fundamentals and the Hannities.

So yea, I needed every brain cell I had to figure out what the current program was.

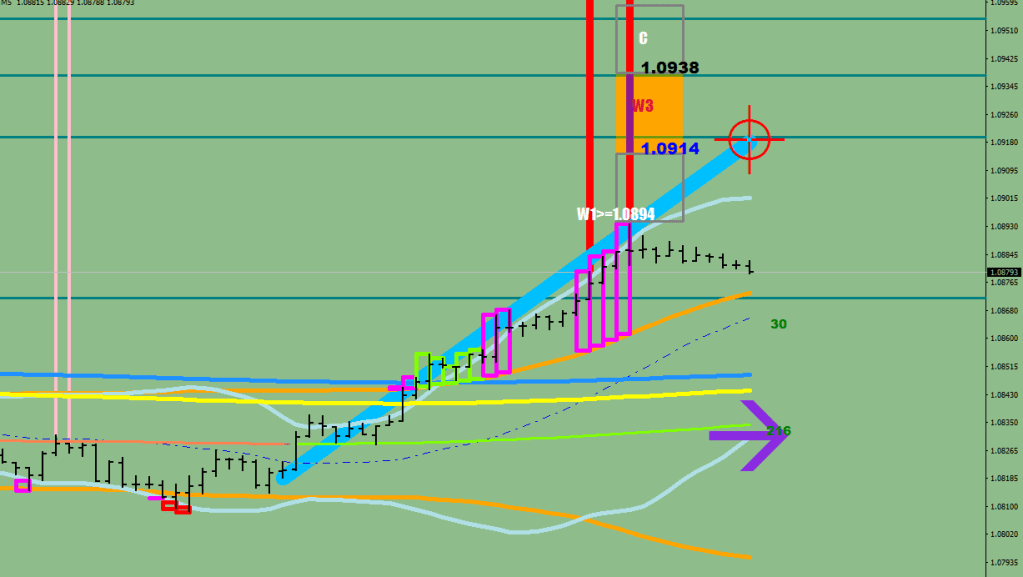
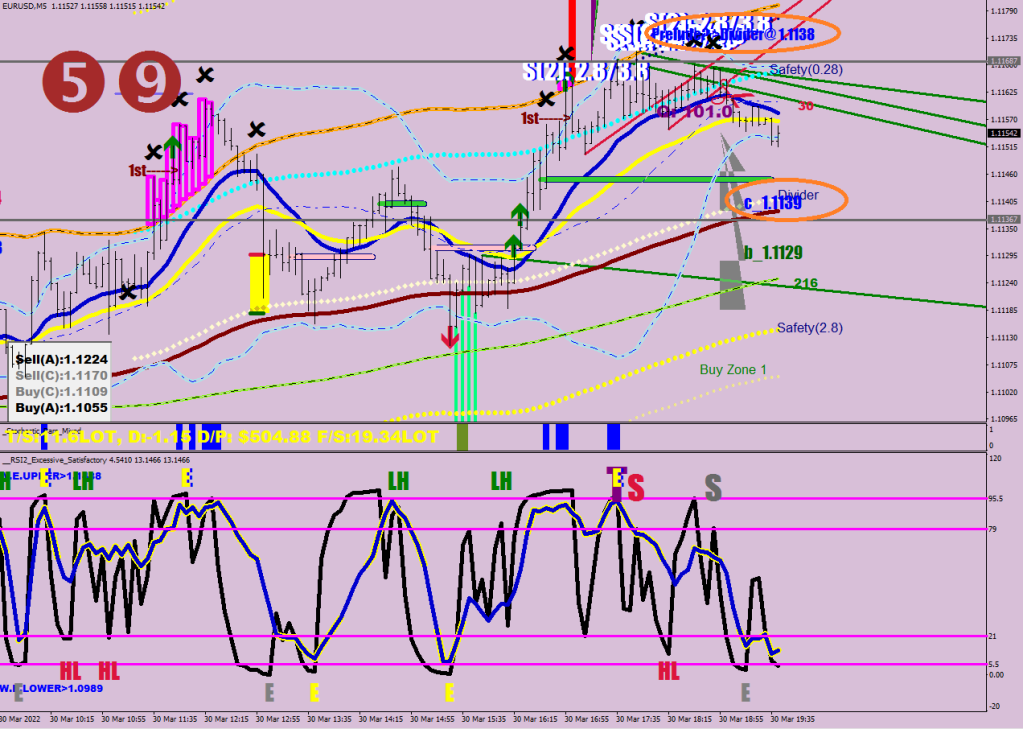
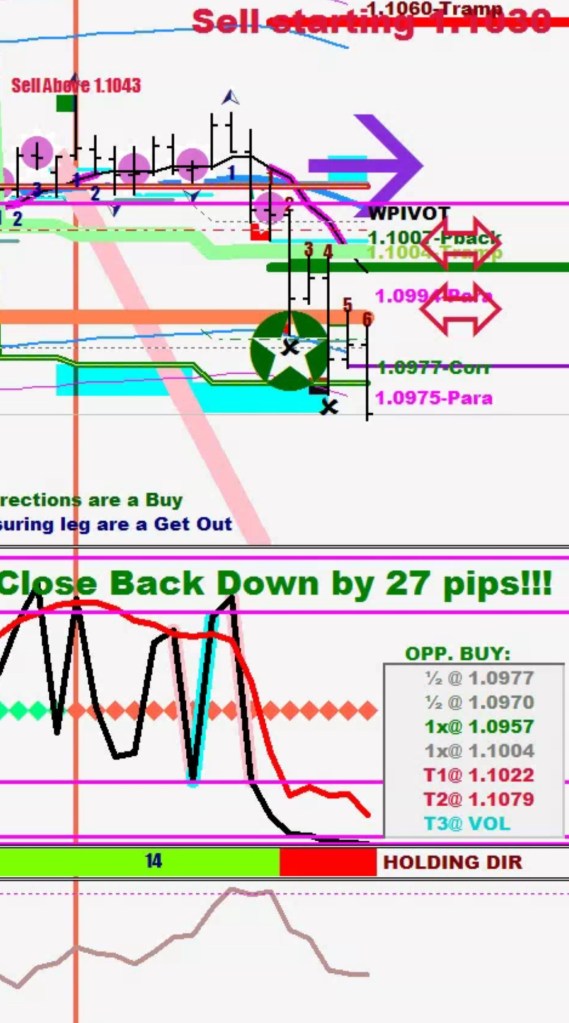
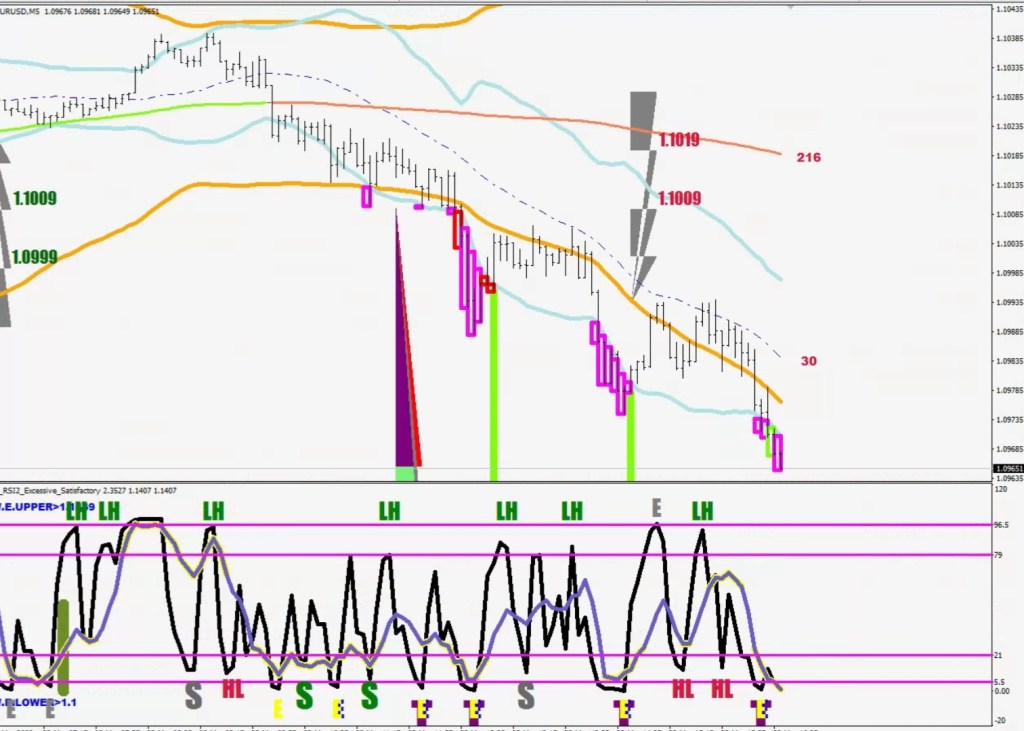
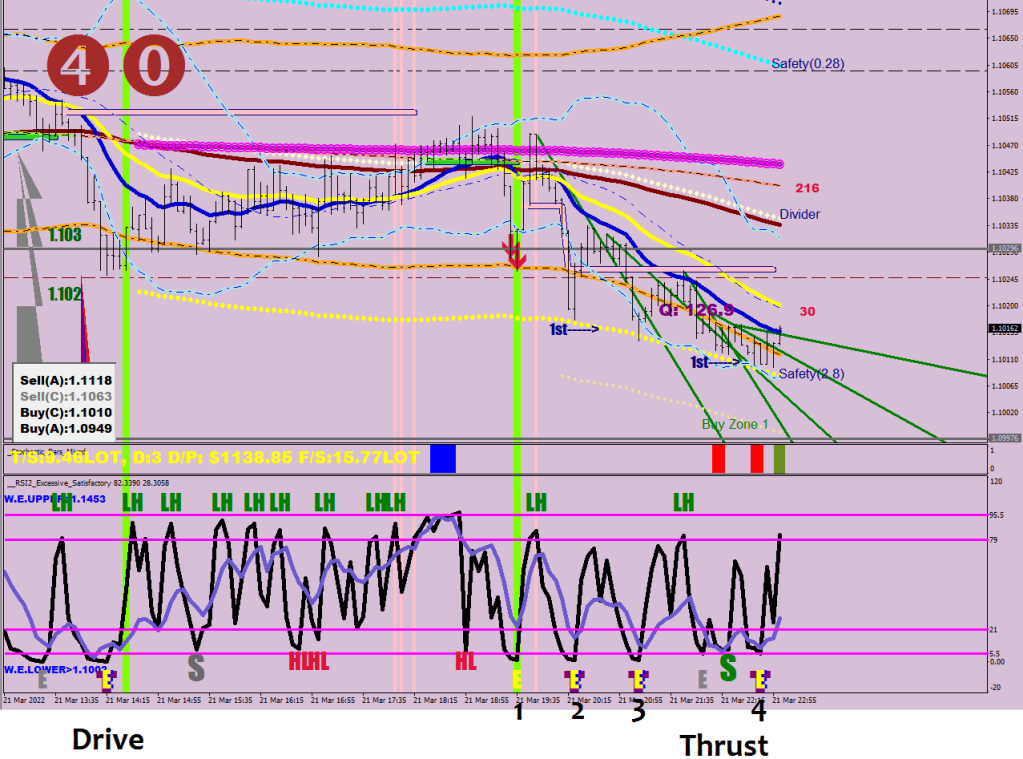
Sell double volatility breaches (preferably divergent legs) as long as they are made below the window envelope and target a new lower low (216 sample on 5 mins). Brother Bollinger gets missed by 5-10 pips every time.

////lower excess
      
      if (iLow(symbol,0,iLowest(symbol,0,MODE_LOW,216,i+2))>iLow(symbol,0,iLowest(symbol,0,MODE_LOW,2,i))) {
         ObjectCreate("Miezzz"+DoubleToStr(i), OBJ_TEXT, indicator_window, Time[i], 4); 
         ObjectSetText("Miezzz"+DoubleToStr(i), "X", 42, "Impact", clrPurple);  

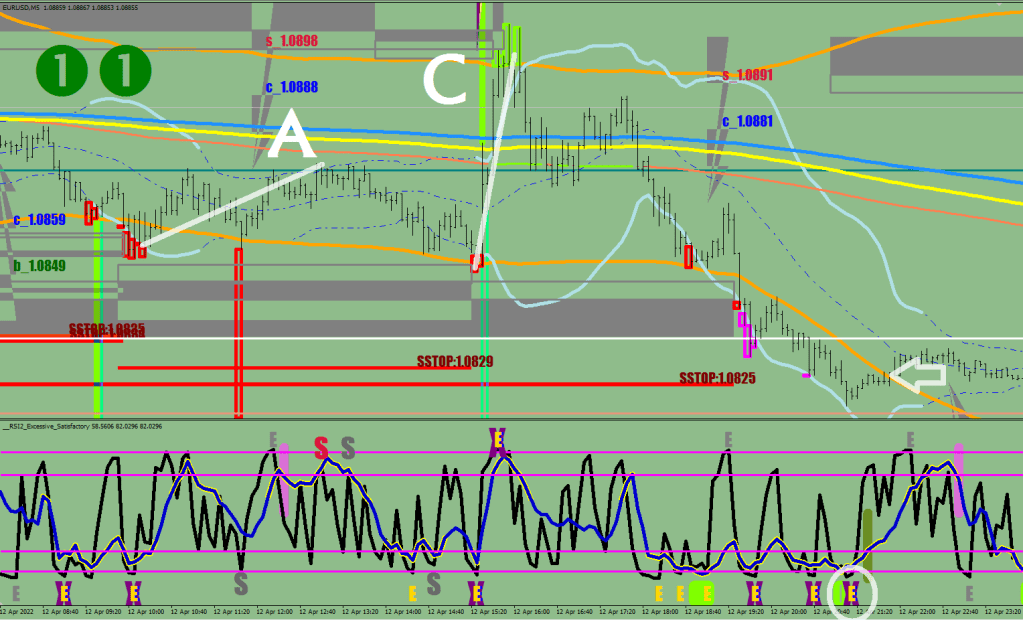
E-X Machina. The Window Envelope (14 samp) is at 1.0918 this week.

Now I feel violently happy.

When you know that a Wave 3 would come in starting 1.0915, then you know that a wave 1 is likely to fizzle out 20 pips short of that. I gave you the 15-ATR Targets Pro for a reason. Use it.

Editor’s Bird

From our editor and circuit raper breaker, Nick Rhodes.

Pay attention to the magenta fields exceeding one day.

When the time is up, resurrection sets in for a move to be making an ABC sequence made up of a measuring leg and a divergent leg that is going to be improving on the ultimate swing high.

Therefore the game plan for Monday is (it has to rally at least 60 pips from the prior close first):

If the body of the candle exceeds 100 pips, buy near the oversold level of the day’s range.

If the body does not exceed 100 pips, buy right before the daily close for a 220+ pips move up.

Now, concentrate on the main issue here. 236 views over 8 years, what is wrong with people?

Bjorn Lynne seems to be the most under appreciated musician on YouTube.

Momentum Raping #3

Today we are short on teachers, so I’m going to hold the biology, music and trading lessons in one.

Let’s start with Finland. How can a small nation like them be such a powerhouse of synthetiser music? This remains a mistery.

Wonderful you and me. I actually have this CD.

Shrieks and Sighs and Calm Delight are some of the master pieces of Neuroactive even in terms of the poetry involved.

The logic of the “you’re gonna leave now, and hope for something better” still fills me up with joy about how different it is.

Kimmo’s voice is incredible.

Kebu is a true heavyweight champion of composition as well as a virtuose player.

Just what I would like to hear on my funeral.

Once I make it big, he’ll be the first one I’d invite to give a concert on my island in the Caribbean.

I only met a couple of Finns during the Koszovo war, and they told me about kezi and vizi that were of the same root in our languages (kez & viz in Hungarian).

For biology, I’m gonna hand out this short video on the Uralians.

Now, let’s portion out some momentum trading bones to the eager puppies who came.

Stare at the Daily chart, and ask yourself, what’s missing?

In the direction that the martet is progressing, the wicks should become ever shorter. If they become longer, that means that the counter momentum is growing and it may flip the boat soon.

The adequate question as of yesterday would had been, where is the larger/cover wick and play the ABC terminal as an entry fora cover low which means a 4-sample lower low. Yesterday closed back outside the deeply oversold (below 8) which meant that the final cover low was yet to be made. With tofay’s candle loss the stochastic went as low as 3.5, what is important that at the close the k will still be in the deeply oversold still but price would be off the low by 27 pips.

A temporary loss of momentum can occur after a discharge on the BB
(along with losing deeply OB or deeply OS), which triggers an ABC move where both A and C would be taken to the extreme of a double volaility breach and C may not exceed A.

Yet again, the post partum image shows price and the Daily Bollinger to have met, nevertheless, price only got within 10 pips of it when it was charging, but now the Band is reeled back into the price’s field.

Momentum Raping #2

Once the daily momentum had turned, all moves back towards that point would be retracements and would not exceed that terminal.

First time I was afraid, I was pacified.

There are only 3 things that can turn back the daily momentum.

Second time I was afraid, I was specified.

1: cover high/ cover low with optimal stochastic reading

2: impulse wave choking on momentum setting up a reversal divergence

3: Murena Williams Goonies-Player aka E44 and the safety net behind her

Now that we found momentum, what are we gonna do with it?

If you are below the main weekly MAs (i.e. Baer Market) and making a fresh run to the downside, target something that no one has on their screen other than professional momentum traders. Target the window envelope.

If the market stalls on the way down with a single overdrive + strong E + weak S or a quad E sequence cover half/all and re-enter on a strong E on the upside.

On the second run you may nurture target ideas further out, as it is most likely a Wave 3. What about on the 3rd return? I’m glad you asked.

Let’s talk Triumph cards then.

Bear with me, the honey color gets serious utilization here.

Until you figure out where the exits are, your knowledge equates to… (fill in blank)

What you need to know about the Bollinger Bands is that the current closing price has a great effect on them, meaning: when price is headed towards the Band, it also is pushing it further out, therefore if you want your algo to target the Bands, you need to aim say 5 pips closer.

The Yellow line is the hourly E-32 or the E-384 on the 5-min.

Whilst this image shows price having managed to pierce through the Daily Bollinger Band, in reality it never reached it, but as price started moving back up, it dragged the Band a little higher, like a blanket, eventually covering the feet. This was Macdulio’s enhanced Bollinger Band Course for entirely free.

Excessive definition
if (RSI2[i]<96.5 && RSI2[i+1]>96.5 && RSI2[ArrayMinimum(RSI2,6,i+1)]<80) excess[i+1]=1;
  if (RSI2[i]>5.5 && RSI2[i+1]<5.5 && RSI2[ArrayMaximum(RSI2,8,i+1)]>20) excess[i+1]=-1;

80-sample E drop shadow>
iHigh(symbol,0,iHighest(symbol,0,MODE_HIGH,78,i+2))<iHigh(symbol,0,iHighest(symbol,0,MODE_HIGH,2,i))

overdrive>
stoch[i]>94.5 or stoch[i]<5.5 where stoch is an 18-sample K
iStochastic(symbol,0,18,3,3,MODE_SMA,0,MODE_MAIN,i)

S means falling short
S has no color if they are in the inner half of magenta bands
S for instance>
RSI2[i]<79 && RSI2[i+1]>79 && RSI2[i+1]<95.5 && RSI2[i+3]<RSI2[i+1] && excess[ArrayMaximum(excess,24,i)]>0  && excess[ArrayMinimum(excess,24,i)]==0

Show me the meaning of being humorous.

Momentum Raping #1

A lot of people declare themselves as momentum traders.

Since I am not everyone else, I can only give you my ideas on what Momentum Trading should mean.

Yes, when the rate of price change (trajectory) of price changes declines, that shows tiredness and your odds improve for a mean reversion.

I want to go into the nitty gritty however.

How does price turn around at all?

Strength has to transpire. This is one of the 3 corner stones.

As a momentum trader your friends should be oscillators and moving averages. Divergences too with the caveat that they area a pressure relief called upon by excessive strength.

This is the first lesson here. You should not be looking at divergences as a reversal indicator. The most common waves are corrective and they end in optimal strength prompting no reversal divergences.

Divergences are not the typical ending of a wave. They are showing “momentum slowing” until the scale is tipped.
The stochastic did not make it back to the overbought, yet price still turned back down?

See, the reversal off a reversal divergence is a weak one. An encounter with the 1-standard deviation of the 20 SMA of the 44 daily EMA may re-instate the trend in a jiffy. Lesson number 2.

It pays out to keep track of the presence of professional volume blocks in momentum trading.
Lesson number 3 is that strength has to walk a fine line to stick the landing for a reversal.
Number 4 is still about the day of the reversal, which is a Cover high / Cover low made with optimal strength (most likely) and only divergences have a luxury of dying slowly and temporarily running out of momentum without printing a Cover low / Cover high at the low / high.
Let’s conclude here that momentum trading starts with a daily 18-sample stochastic reading and monitoring for Cover highs / Cover lows as well as keeping an eye out for divergences that are brought on by excessive strength.

Your first piece of information derived from the daily chart therefore is that there was a red Cover high most recently meaning that the daily momentum is down.

Dubla Duplo

Yea, I made this new 2-hr candle constructor boa a few days back. Civil name at birth was given as 2H Mean.

Warning, the following blog entry has a high mortal rate.

It could had come in handy for participating in this most recent 160-pip and counting move up.

The idea was sample: hide as much unnecessary info as possible.

E44 in blue, E8-opens in black. The two colored line is 50% of the last hourly candle.

The two constructed candles are the previous 2 candles combined and the other 2 prior to that with some spacing. Color based again on closing above or below the halfway mark.

Fractals are out for some swing point references.

The horizontal line is the current price – showing a break out currently.

Yes, the constructed candles would look a bit different in odd and even hours, but should this bother you or entertain you?

I’m considering to put an arrow head on the end of the line, yes.

The idea is longevity. Staying in the trade until the config is in your direction and the 2H Mean settles at or above the black line. The risk here is a God Day 1.


ObjectDelete("Candle1");

ObjectCreate("Candle1", OBJ_RECTANGLE, 0, Time[4],  iHigh(symbol,0,iHighest(symbol,0,MODE_HIGH,2,1)), Time[3], iLow(symbol,0,iLowest(symbol,0,MODE_LOW,2,1)));
if ((iHigh(symbol,0,iHighest(symbol,0,MODE_HIGH,2,1))+iLow(symbol,0,iLowest(symbol,0,MODE_LOW,2,1)))/2>(iHigh(symbol,0,iHighest(symbol,0,MODE_HIGH,2,3))+iLow(symbol,0,iLowest(symbol,0,MODE_LOW,2,3)))/2) ObjectSetInteger(0,"Candle1",OBJPROP_COLOR,clrGreen);
else ObjectSetInteger(0,"Candle1",OBJPROP_COLOR,clrCrimson);
ObjectSet("Candle1",OBJPROP_BACK,0);
ObjectSet("Candle1",OBJPROP_WIDTH,5);   

ObjectDelete("Candle2");

ObjectCreate("Candle2", OBJ_RECTANGLE, 0, Time[7],  iHigh(symbol,0,iHighest(symbol,0,MODE_HIGH,2,3)), Time[6], iLow(symbol,0,iLowest(symbol,0,MODE_LOW,2,3)));
if ((iHigh(symbol,0,iHighest(symbol,0,MODE_HIGH,2,3))+iLow(symbol,0,iLowest(symbol,0,MODE_LOW,2,3)))/2>(iHigh(symbol,0,iHighest(symbol,0,MODE_HIGH,2,5))+iLow(symbol,0,iLowest(symbol,0,MODE_LOW,2,5)))/2) ObjectSetInteger(0,"Candle2",OBJPROP_COLOR,clrGreen);
else ObjectSetInteger(0,"Candle2",OBJPROP_COLOR,clrCrimson);
ObjectSet("Candle2",OBJPROP_BACK,0);
ObjectSet("Candle2",OBJPROP_WIDTH,5); 


The following part is called “take a look at me now.”

Take a look at the divergence on the Advansez/Recliner line below:

Murena “Server” Williams dropped the ball. The Prechter Doctor will see you now. The whole thing started with a Pro Volume day.

How interesting was this? Yesterday’s cover high had its moratorium field extending to 1.1164 and today set a high at 1.11706. A few more pips are always advised to tolerate an increased spread. The target is so close, yet so far away (Stoch @ 78.93). A capitulation with no momentum left. The top would only be in on a Cover high that is going to score above 82 on the settlement. Perhaps a pullback first.

iStochastic(symbol,0,18,3,3,MODE_SMA,0,MODE_MAIN,i)>82

The dip below the 20MA of the 14 RSI is a buy until it is not (red circles and exclamation marks).

This market is now running for its death.


E-S-S eso E-S-S aka Rain It On The Blame w/ a side of suicide.

The Green O-s are early warnings for a low to be hit soon. (Stoch 18K<5.5)

In short this song is about a drug addict who kills her girlfriend with 36 stabs and ends up walking free since he himself is was a “victim of the drugs”.

Ess eső, ess

Reggel volt, napsütés nélkül, a kiscsaj éppen a suliba készült.
Még nem sejtette, hogy el fog késni, s nagyon messze az az érettségi.
Csengettek, s ő beengedte, mert a tegnap estét már elfeledte.
A barát volt, megállt előtte herointól szénné lőve.
És indult a cirkusz, a féltékenység, a hernyótól nőtt meg szörnyeteggé.
A lány már sírt, csak menni akart, a lárma a házban senkit nem zavart.
Az első pofon még alig fájt, csak ütött a srác és felszakadt a száj.
A lány elesett és semmit nem érzett, pedig rossz bőrben volt és csúnyán vérzett.
A fiú most megállt, nem, nem ütött többet, Júlia ekkor még arcon köpte:
- Rómeo hagyj! Ne csináld, kérlek!
De penge villant és kés volt a kézben.

Harminchat szúrás a testen. Mosd le a vért! Az eső essen!
Örök sötét a gyilkos fejben. Sírjon az ég! Az eső essen!

Ess, eső, ess, ess! Hullj rá az arcomra!
Ess, eső, ess, ess! Hullj rá az álmokra!

Jött egy ügyvéd, mert volt rá lé, kétmillió a védőbeszéd:
- A lány drogos volt, a fiú drogos volt, az elmeállapot korlátolt!
Nincs gyilkos, a narkó divat, szegény srác, hisz ő is áldozat!
Kórházba vinni, kezelni kéne, ennyi az egész, az ügynek vége!
A lány nem él, a fiú még remél, a bíró enged és nincsen büntetés.
Az ügyvéden múlt, s a befolyáson, hogy köztünk jár most szabadlábon.
Nincs több érv, nincsen könny, hullaszáraz a jegyzőkönyv.
Hol az a reggel, mikor 7 óra múlt, s a kiscsaj éppen a suliba indult?

Harminchat szúrás a testen. Mosd le a vért! Az eső essen!
Örök sötét a gyilkos fejben. Sírjon az ég! Az eső essen!

Ess, eső, ess, ess! Hullj rá az arcomra!
Ess, eső, ess, ess! Hullj rá az álmokra! ...

When you’re gone, how can I even try to go on?


Le Crack.

In a Senior DownTrend

You short within 3 pips of a previous hourly fractal.

The last one went beyond the first fractal on the measuring move making a higher low, this is why there was no need for the re-test and could get active at the second stumbling block.

You target the first Gray E’s 16-pip displacement for an exit. Go long at the 26-pip displacement & target just shy of the next fractal up.

Catching a capsizing turn can also qualify for a long entry.

You can already see what the next target would be.

I used the SuperTramp, settings posted on the blog earlier with an identical title.

I call a trend Junior after 5 hourly same color prints and senior after 14.

   ObjectCreate("PRALINE", OBJ_TEXT, indicator_window, Time[0], 1);  
      ObjectSetText("PRALINE", "                            TRANSITIONING", 11, "Arial Black", Maroon);   
  
        if ( Direction[1]==-1 && Direction[2]==-1 && Direction[3]==-1 && Direction[4]==-1) 
      ObjectSetText("PRALINE", "                            JUNIOR D/T ", 11, "Arial Black", Crimson);  
       if ( Direction[1]==-1 && Direction[2]==-1 && Direction[3]==-1 && Direction[4]==-1 && Direction[5]==-1 && Direction[6]==-1 && Direction[7]==-1 && Direction[8]==-1 && Direction[9]==-1 && Direction[10]==-1
         && Direction[11]==-1 && Direction[12]==-1 && Direction[13]==-1)  
      ObjectSetText("PRALINE", "                            SENIOR D/T ", 11, "Arial Black", Crimson);         
           if (Direction[0]==1 && Direction[1]==1 && Direction[2]==1 && Direction[3]==1 && Direction[4]==1)
      ObjectSetText("PRALINE", "                            JUNIOR U/T ", 11, "Arial Black", DarkGreen);  
       if (Direction[0]==1 && Direction[1]==1 && Direction[2]==1 && Direction[3]==1 && Direction[4]==1 && Direction[5]==1 && Direction[6]==1 && Direction[7]==1 && Direction[8]==1 && Direction[9]==1 && Direction[10]==1
         && Direction[11]==1 && Direction[12]==1 && Direction[13]==1)    
      ObjectSetText("PRALINE", "                          SENIOR U/T ", 11, "Arial Black", DarkGreen);

This album is a delicacy from the most underappreciated band of the 90s. It tickles some organs you did not know existed. This is what you would get if you marry The Cure with Dead Can Dance, but who would even think of such a thing?
Senior uptrend last minute buy: the fractal on the left was at 1.09604 and the buy level was 1.09634. Pull out that calculator!

My Chemical Imbalance

What are the two chices of a market that is overwhelmingly long/short?

Capsize or capitulate.

The daily checkpoint comes back with no balance: the close back was less than 27 pips from the high/low. There would be an attempt for the continuation. You would see a hourly candle separating from the 8-open-EMA.

#2 closing back down renamed #1 to Captain Capsize. Also, the 67-sample Momentum crossing back above 100 underlined this perfect short.

If the second or the third candle closes on the other side, the boat was just flipped. Also, look at the 5-min 2.0 30 SMA HL2 ans the 2.5 216 SMA HL2 to get a sense for the prospect sustainability of the continuation move.

What were the odds of continuing higher after re-visiting and failing the breach of the 2.0 BB right below the 2.5?

Vol-Aparte Napoleon

The objective of the driven thrusts is to work up volatility.

Volatility has no direction, this is why a pendulum market model is apt.

Volatility gets capped in one direction by the act of buying, this means that sustained progress can only be reached with ever more dedicated money to the cause.

The natural tendency of the market is idling, so the volatility is bound to decrease.
Low volatility is nobody’s objective: you cannot make money if price does not move.

During trending the 30 SMA on the 5-minute is a suspect for volatility-cap add on.

A drive sets up the level called the tripwire.

4 volatile trips (4 broken legs) mark the end of a wave structure. Think of the fractal nature of the individual time frames: your chosen zoom may not be able to show you all the details.

First cut is the deepest: The Tripwire


4 24-sample lower lows in combination with Excessive RSI2 readings + BB pop for good measure at the end.

The Trip-Trip Traps

Raindrops are falling in the brain…

Living’s in the way we die. (Few understand this).

What is happening?

Does this look good?

Looks O.K.

Does this volatility crush / mean reversion freak you out?

Not really.

Yet.

We failed this week and the last week to leave the oversold level behind. In fact, we are due to re-embed come next week. Seasonality might just get a punch in the face.
Does an ABC correction sound bullish followed by today’s candle making a lower high and a lower low?

Blinded by the light?

Oh yeah, back to the topic. Traps. ET.

ET is an 18-hour higher high with RSI2 reaching above 95.5. An Excessive move (a drive) ultimately results in a thrust, that is in line with the current volatility. The first print counts (and embedding disqualifies).
Think of it like this: if volatility is way high, you can have a thrust from the trip wire at 66+ pips. One step down in volatility and you are looking at 55+, then 44, 33.

Now, counter moves fizzle out on two Excessive peak prints & their initial drive is usually a subdued acceleration not achieving a 30-sample bracket break on the 5-min.

The thrust of the correction is also volatility based. 26+ pips is high relatively high, 16+ is two steps down, then 8 and 4. The highest reading would just exceed 32 pips.

So is this setup bullish then? Remember the E+E. Look at those trip wires right above. Think of the embedding come next week… and hedge for crying out loud.