Counter Force

A lot going on this week.

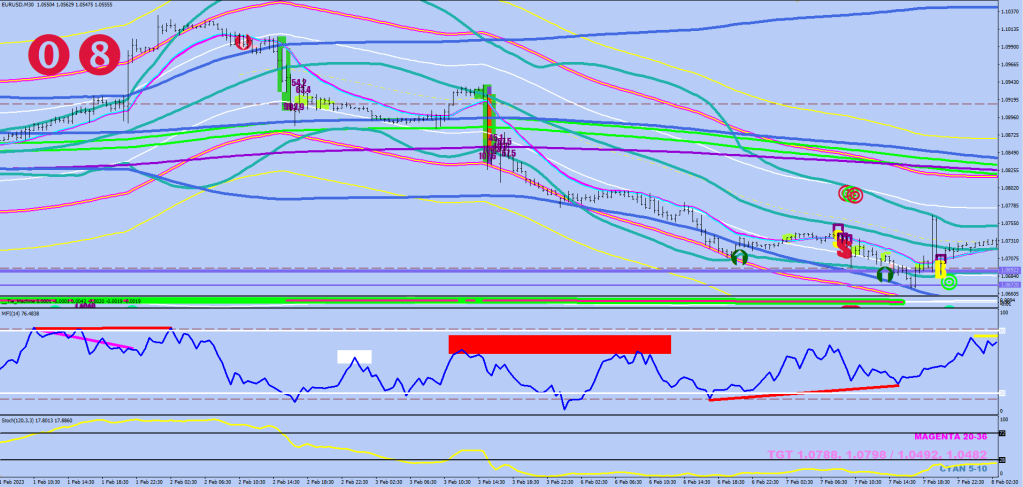
Most importanly I latched onto the 8 EMO like a hawk. Things escalated to the point when I even went into a loop thinking about having to find a protege.

So, thunder, outage, having to walk up 12 floors with my heavy backpack (both lifts down, good thing I did not choose the 17th floor), finding no hot water (boiler needs to be reset too) and a number of light bulbs lit up.

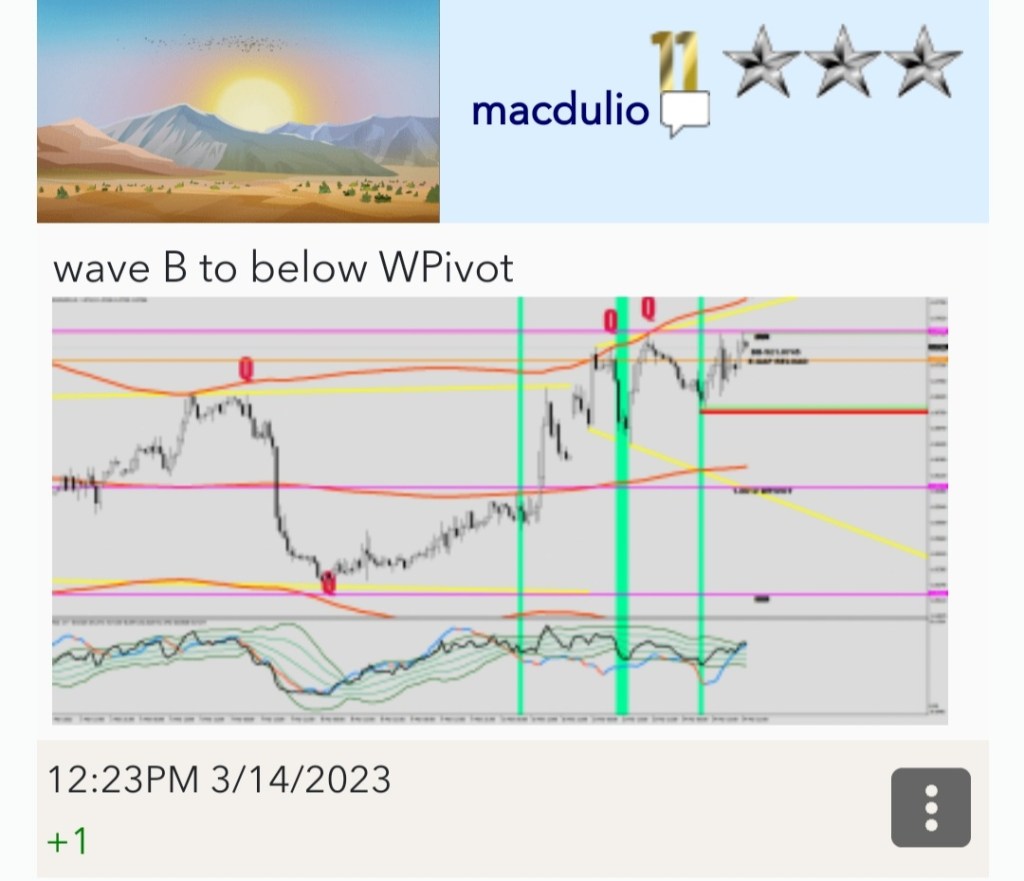
Quickly about Goldie, Silvergate and Scooter.

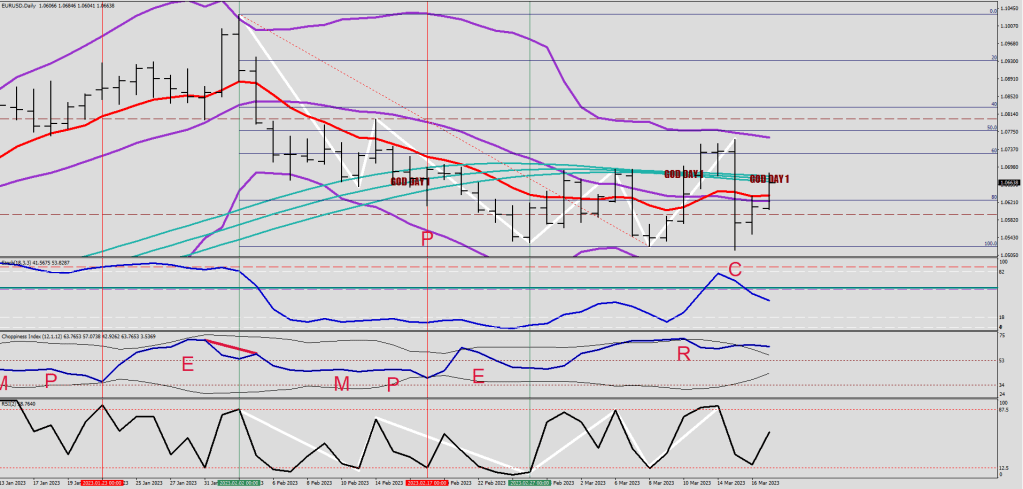
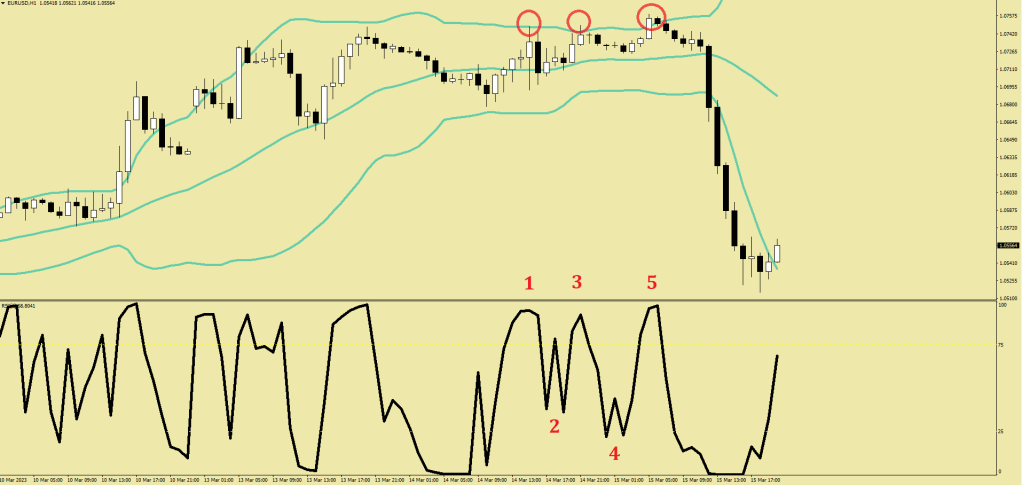
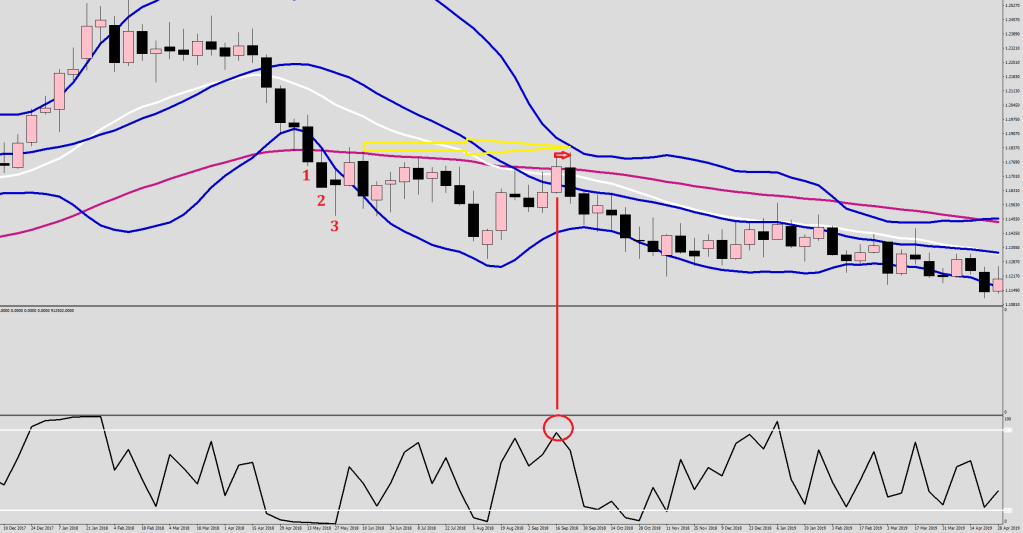
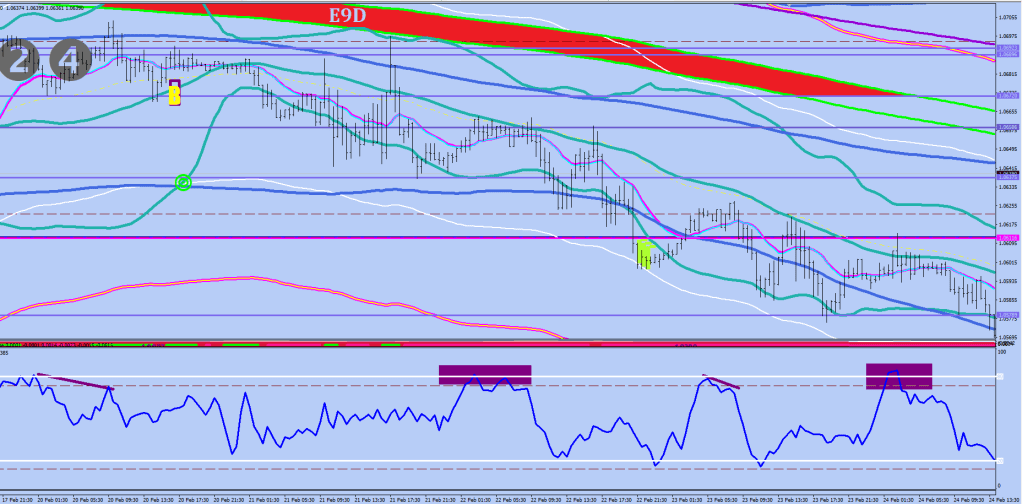
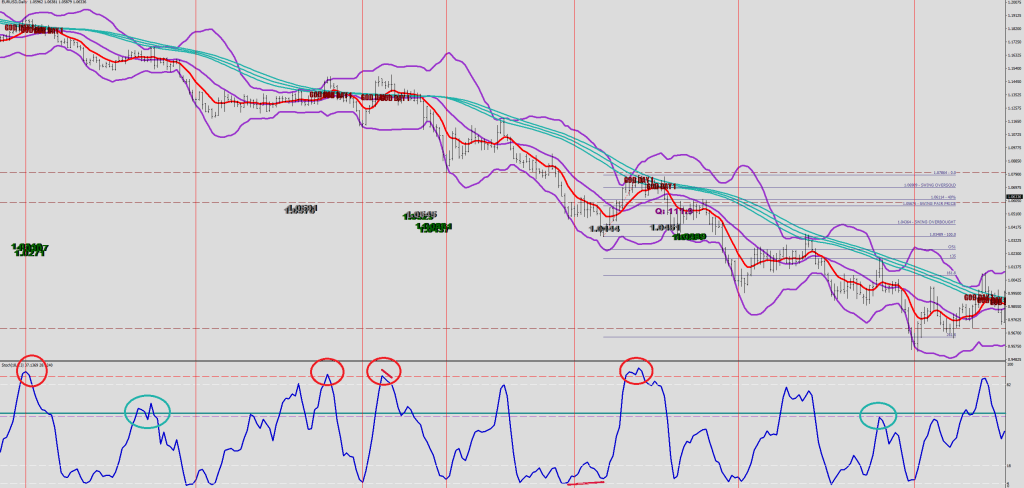
I measure a fully consolidated charge on the 15-min 48 sample CI above 53.

if (ChoppinessIndex(12*4,i)>53 && ChoppinessIndex(12*4,i+1)<53) break;

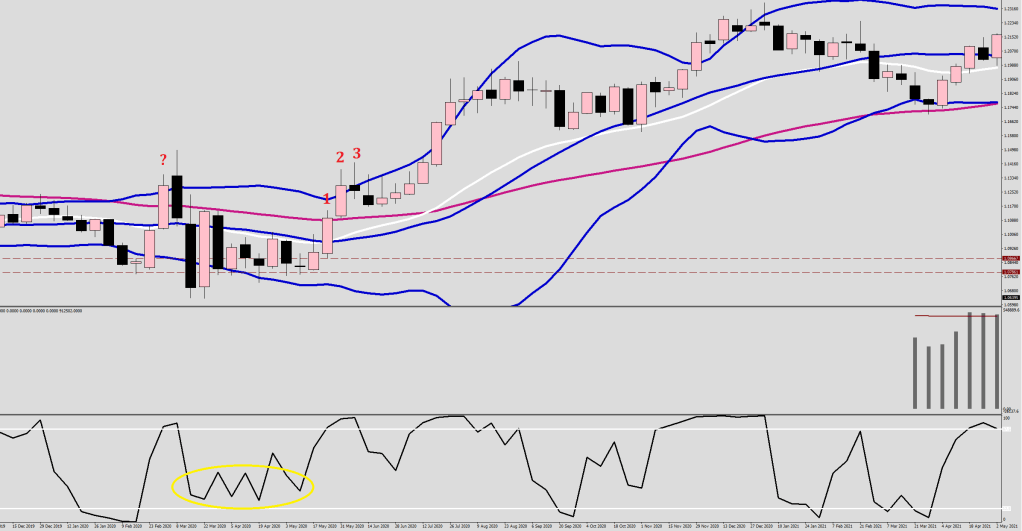
weight=(iHigh(symbol,15,i)+iLow(symbol,15,i))/2;

I measure distance probabilities based on the 3-day ATR (starting last day).


      ATRA = 0;
   for (i=1; i<=3; i++){ 
     ATRA = ATRA+iATR(NULL,1440,14,i);}
   
   for (i=0; i<=160; i++){ 
     ATRAVG[i] = ATRA/3; }

   BowBuffer=(iClose(symbol,15,i))-ATRAVG[i]*1.30;
   BighBuffer=iClose(symbol,15,i)-ATRAVG[i]; 
   BowBuffer2=iClose(symbol,15,i)+ATRAVG[i];
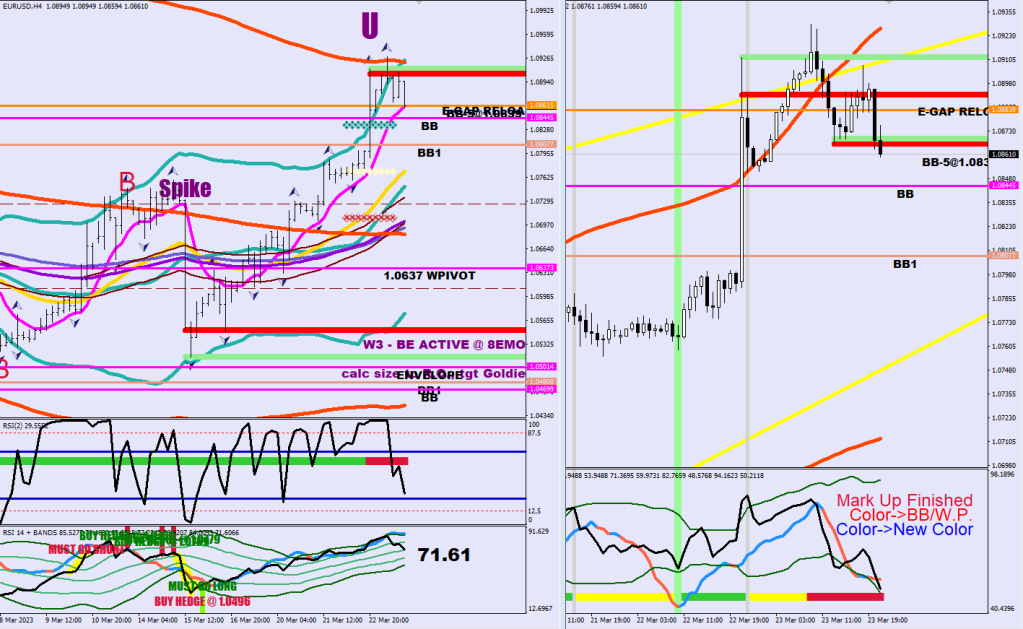
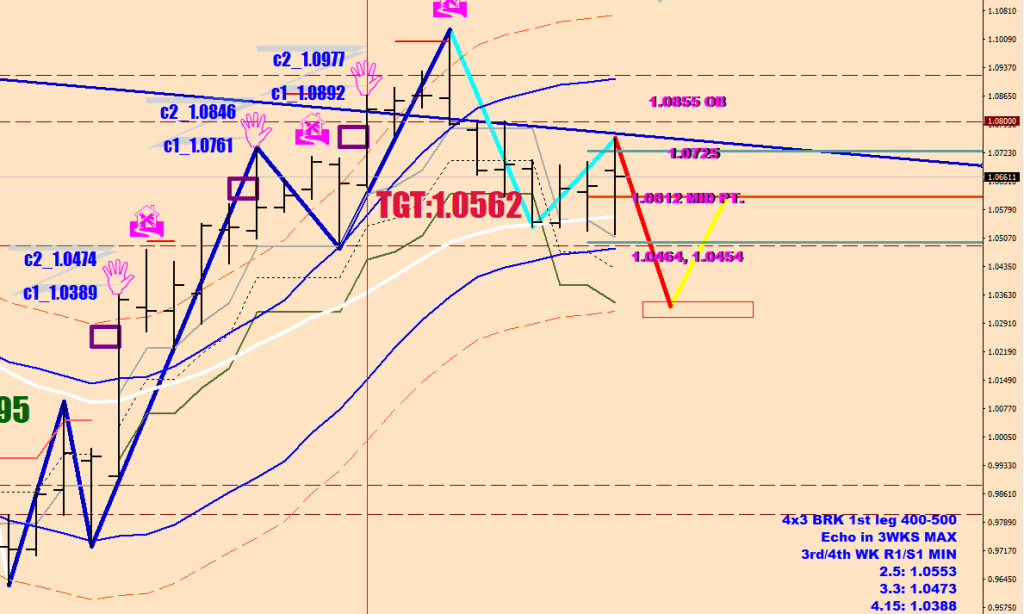
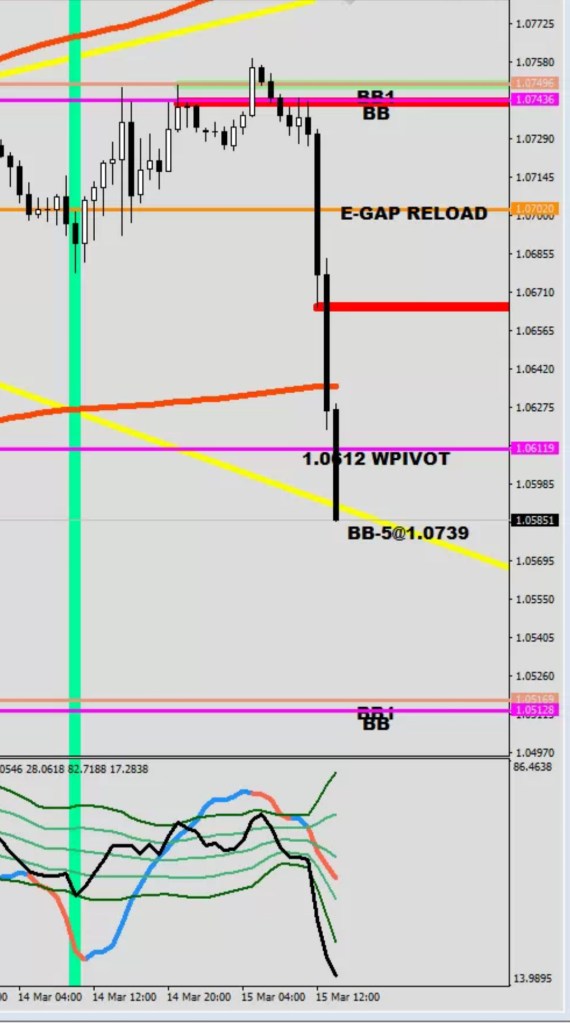
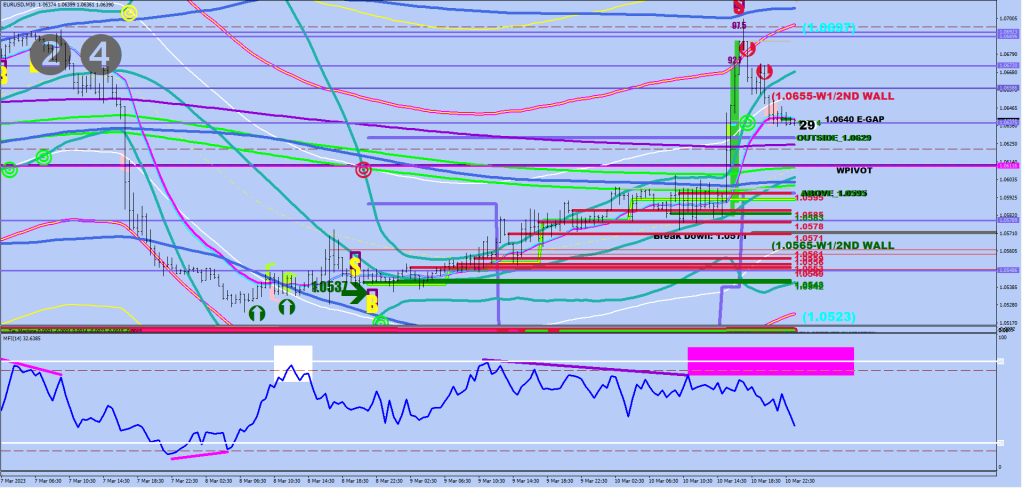
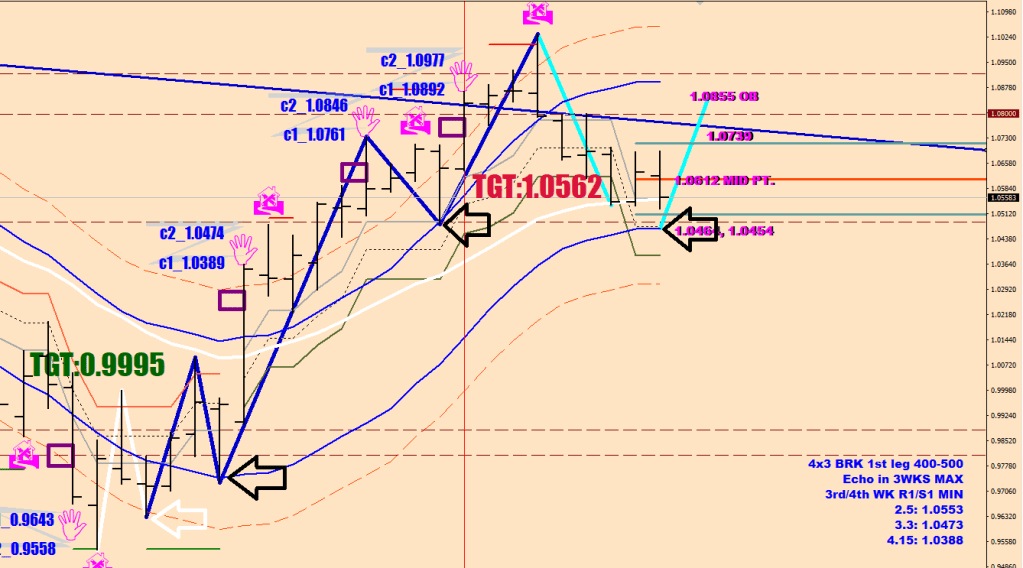
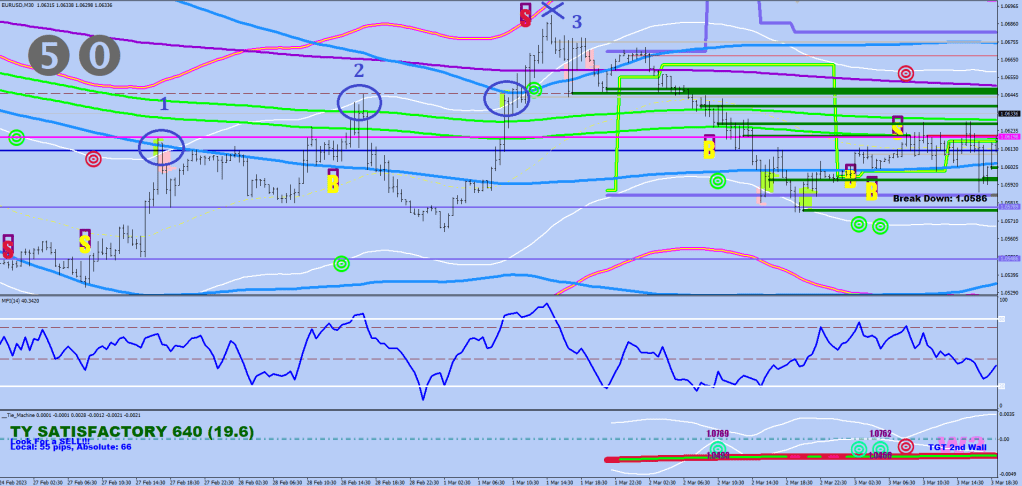
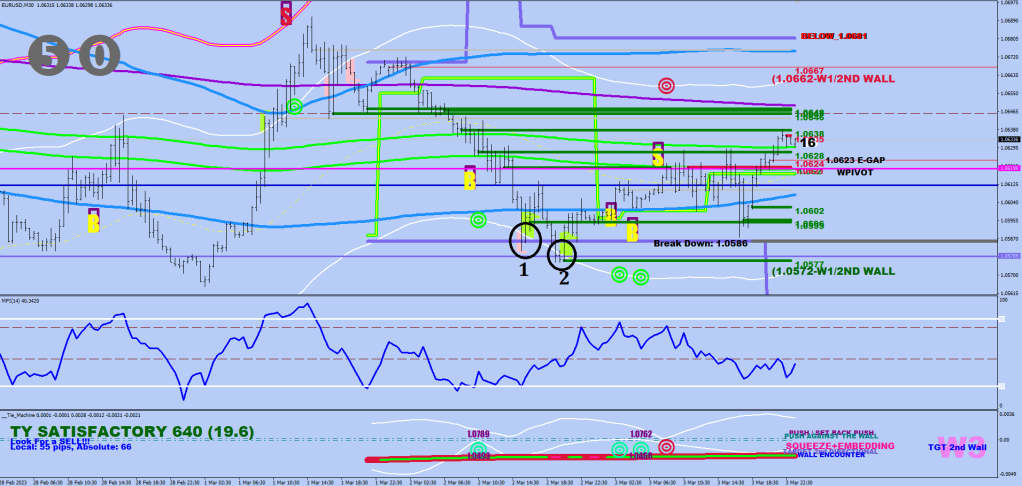
   BighBuffer2=(iClose(symbol,15,i))+ATRAVG[i]*1.30; 

The Goldie Locks level is 10 pips shy of the 3-day ATR measured from the consolidation weight.

The Silvergate is 10 pips shy of the 130% ATR measured from the consolidation weight.

My theory is if the Silvergate is hit, the next target is set at Scooter.

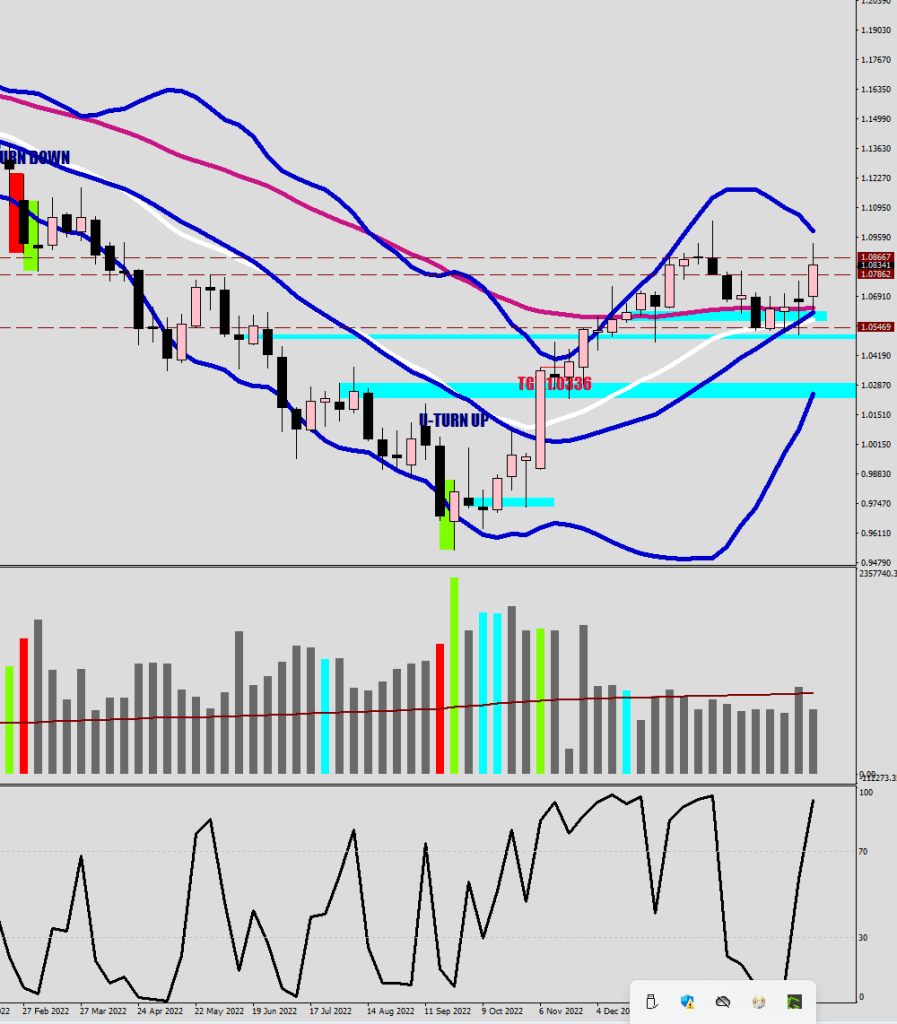
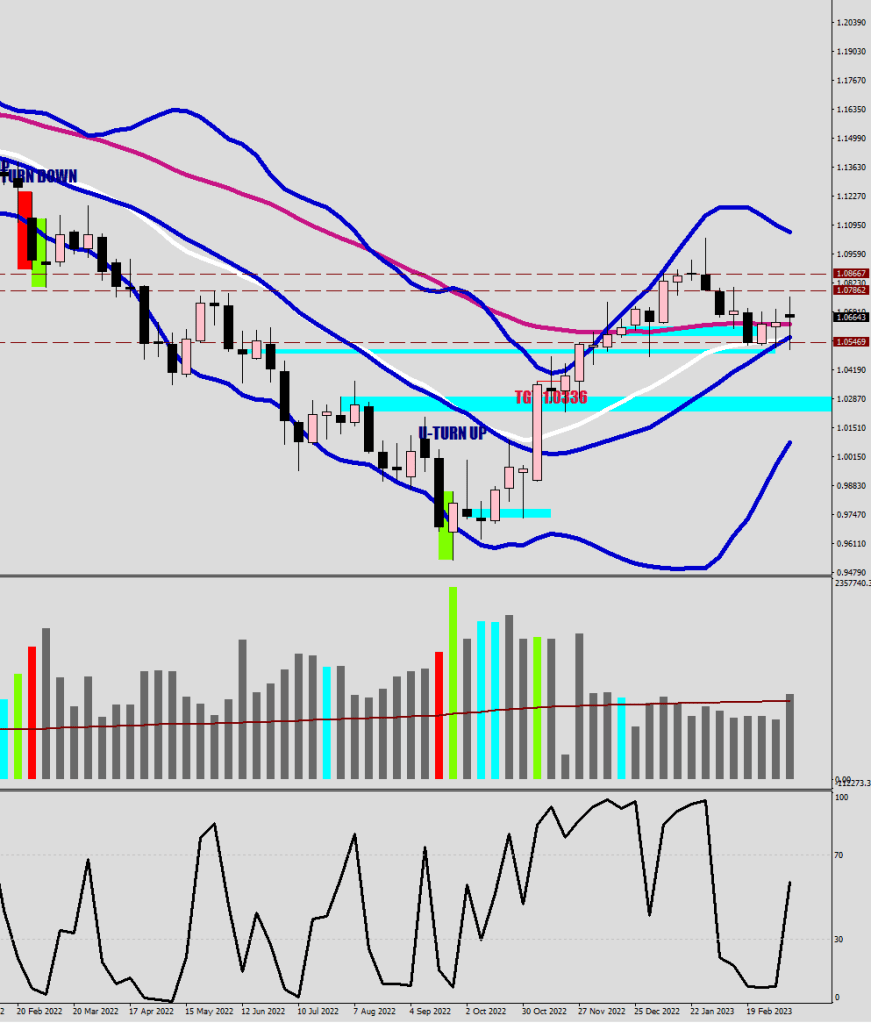
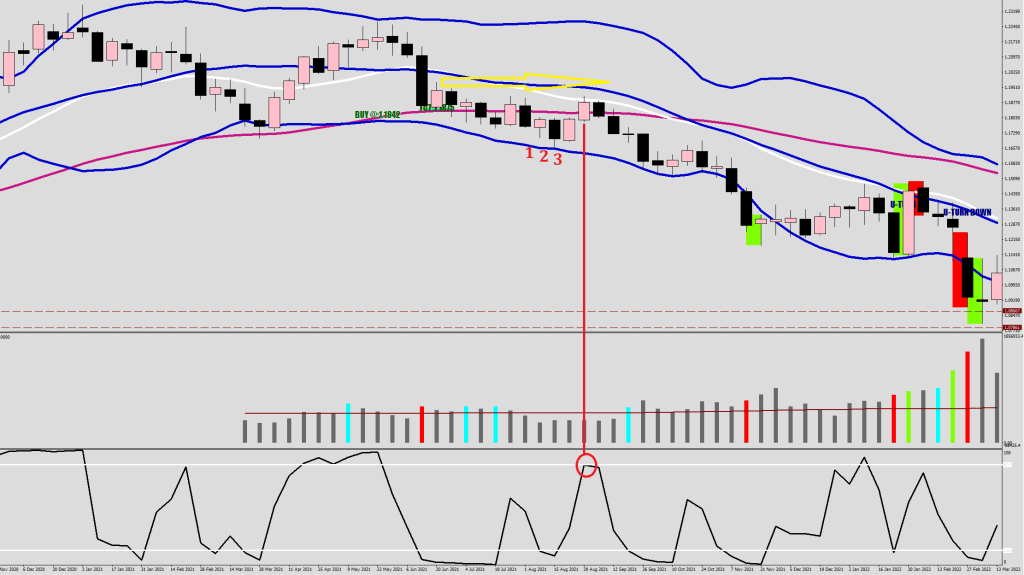
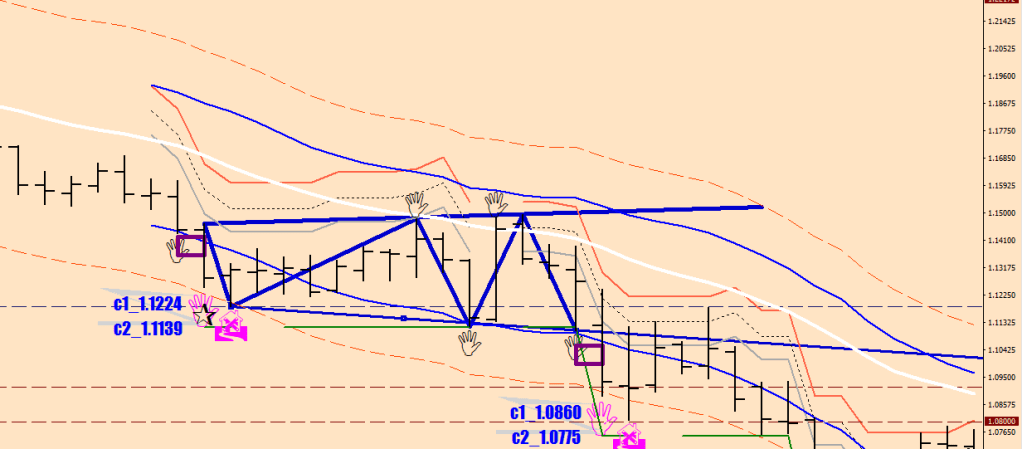
Scooter is the 4-hour 216 sample 2.5 sd Bollinger Band. As a complication it may not always be hit, but on the upside it has been bullseye.

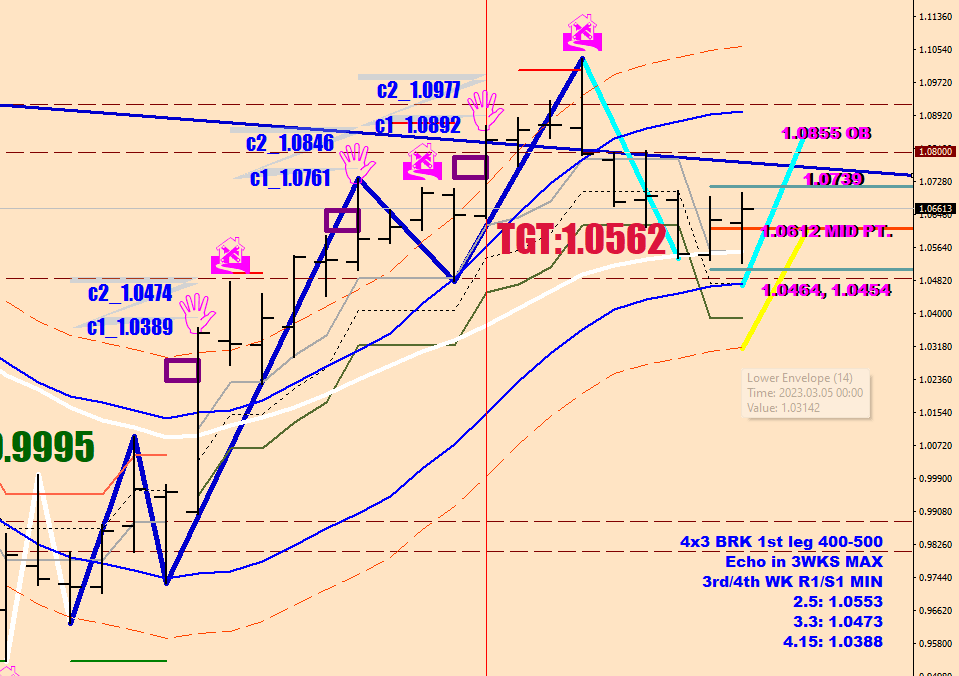
If you need to know, the ultimate target is brought on relative to the last impulse wave that made it out of the 14-sample window envelope on the weekly, but it is not the case currently.

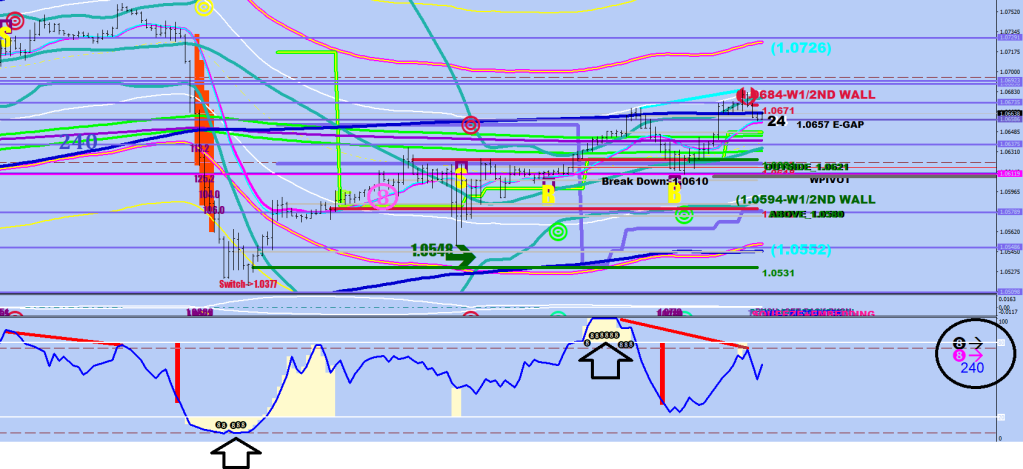
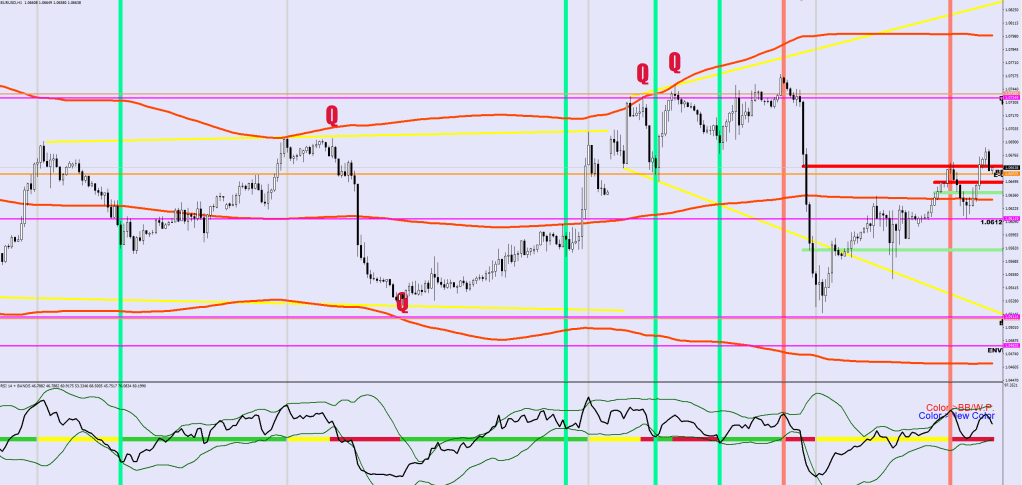
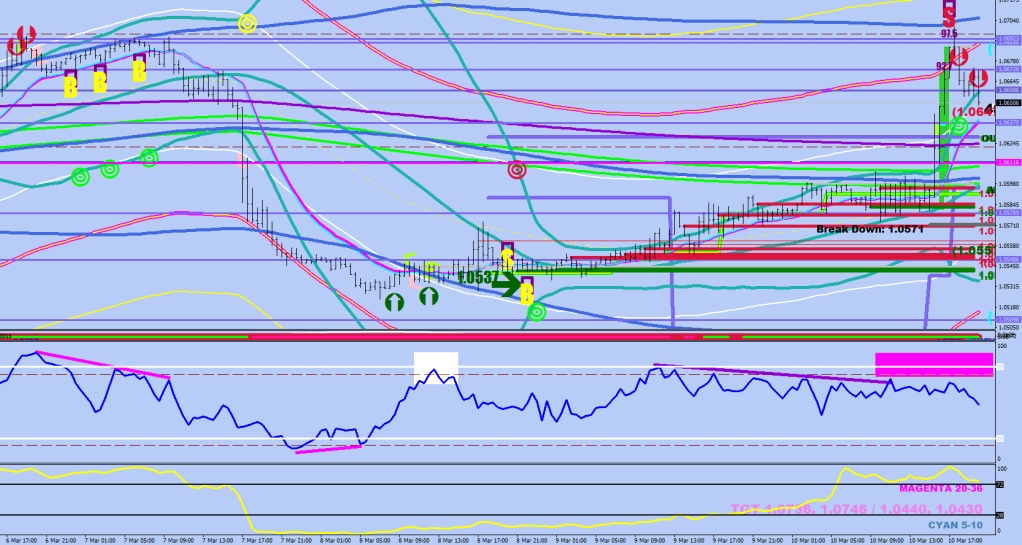
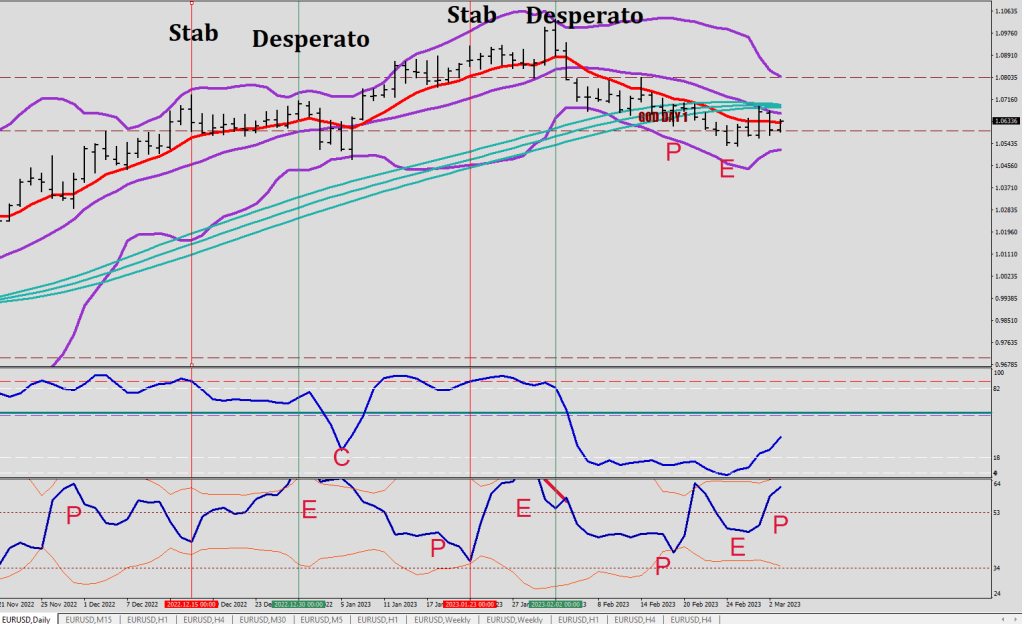
So, the bottom indicator.

It is an ATR with pips in plus minus for the last 8 hours & there is a capping at 80 pips and there is a highlight beyond 60 pips.

 ExtATRBuffer[i]= -1*(iHigh(symbol,0,iHighest(symbol,0,MODE_HIGH,7,i+1))-Low[i])*10000;
 if (ExtATRBuffer[i]<-80) ExtATRBuffer[i]=-80;
 ExtATRBuffer2[i]=(High[i]-iLow(symbol,0,iLowest(symbol,0,MODE_LOW,7,i+1)))*10000;
 if (ExtATRBuffer2[i]>80) ExtATRBuffer2[i]=80;
 if (ExtATRBuffer[i]<-60) ExtATRBuffer3[i]=ExtATRBuffer[i];
 else if (ExtATRBuffer2[i]>60) ExtATRBuffer3[i]=ExtATRBuffer2[i];  

Think of these highlights as overheating which, if the episode is short (1-2 hours), would likely bring on a reversal, but if it was prolonged, there would be an option of cooling off by a consolidation for the continuation.

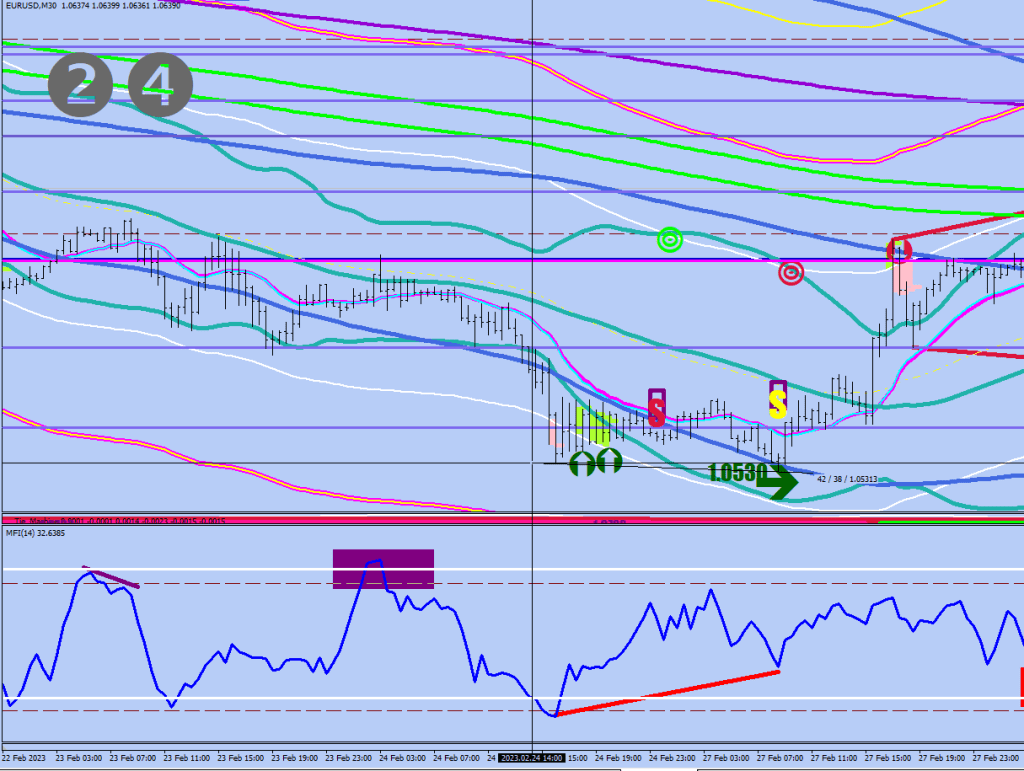
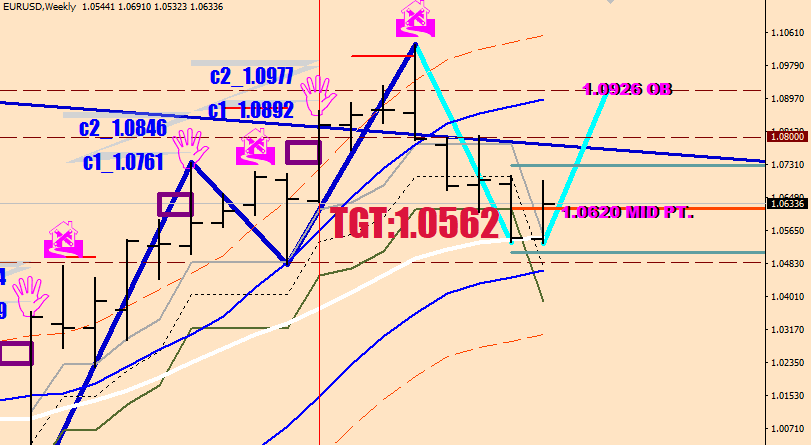
I expect price proceeding lower, but the CI has to get above 53 (plotted next to the current price on the margin), which it will do by the open to re-align the new Goldie and Silvergate levels. Silvergate in general should not be hit, you would need to scale out towards it. Only when the market is in Hyper Hyper that it would trample over to meet its Scooter fate in a last hurrah.

4 Images

Red in Red

Utmost 4H condition + BB216 SD2.5 pro exit was made. E120 hourly at 1.0754.

RSI Enough to turn (Nick Rhodes)

C would take out 4.

14-sample Weekly Window Envelope (2.0)

Friday – down day: weekly RSI2 to close below 87.5 (93.91 currently)

1.0336 next support

MFI Geek II

These are theses.

I don’t aim for multiple instruments or multiple time frames.

I’ve been talking about divergences, but market may turn without one.

Introducing the extremes. MFI is charted on a 0-100 scale.

If a median price extreme starts at 12.5, I would put the extreme of a typical price at 8.

The plot thus is an 8-ball.

On the image below there is a reminder on the right hand side for a black eight ball -> crossing over the 8 EMO (hourly denomination) -> going to the 240 SMA.

The 8 EMO is the 8-sample EMA of Opens. I usually have it in 2 different colors. Here the 240 is as the middle line of the 240-BB.

See, there is no certainty to these steps timely manner. A black 8-ball may be restrained from crossing over the magenta 8 EMO, like in this example:

And if you go back to the first image, the last RESET was not all in one direction: the 8-EMO was below whilst the 240 SMA was above (which is what made the divergence print).

  if (mfi[i]<8){
            ObjectCreate("Roe"+DoubleToStr(i), OBJ_TEXT, 2, Time[i], mfi[i]+10); 
            ObjectSetText("Roe"+DoubleToStr(i), CharToStr(147), 12, "WingDings", Black);
    }
    
       if (mfi[i]>92){
            ObjectCreate("Roe"+DoubleToStr(i), OBJ_TEXT, 2, Time[i], mfi[i]-10); 
            ObjectSetText("Roe"+DoubleToStr(i), CharToStr(147), 12, "WingDings", Black);
    }

But this is just one thing that contributes to a reading on a particular time frame.

I also use a 5-sample smoothing over a 2std banded 14 sample HL2 RSI on the 1-hour timeframe.


MFI[i]=iMFI(symbol,0,14,i);
AVG[i]=((MFI[i]+MFI[i+1]+MFI[i+3]+MFI[i+4]+MFI[i+5])/5);

The main problem with these vertical plots is getting the displacement right. For instance, if I take away the 2-point allowance for the Salmon plots (meaning an RSI-print came within 2-points of the 2 STD band), the first plot would be taken away. Yet if I give too much allowance, I may get too many not-so good signals. The MFI average here is the filter for RSI making the low above the money flow average or not.

 if ( RSI[i+1]>AVG[i+1] && RSI[i+1]<lower2[i+1] && !(RSI[i]>AVG[i] && RSI[i]<lower2[i]) && Period()==60){
  ObjectCreate("LOTUS"+IntegerToString(i),OBJ_VLINE,0, Time[i+1], 0);
      ObjectSet("LOTUS"+IntegerToString(i),OBJPROP_COLOR,clrMediumSpringGreen);
      ObjectSet("LOTUS"+IntegerToString(i),OBJPROP_WIDTH,10);
      ObjectSet("LOTUS"+IntegerToString(i),OBJPROP_BACK,1);
 
 }   
   
  if (RSI[i+1]>69 && RSI[i+1]<AVG[i+1] && RSI[i+1]+2>upper2[i+1] && !(RSI[i]<AVG[i] && RSI[i]+2>upper2[i])&& Period()==60){
  ObjectCreate("LOTUS"+IntegerToString(i),OBJ_VLINE,0, Time[i+1], 0);
      ObjectSet("LOTUS"+IntegerToString(i),OBJPROP_COLOR,clrSalmon);
      ObjectSet("LOTUS"+IntegerToString(i),OBJPROP_WIDTH,10);
      ObjectSet("LOTUS"+IntegerToString(i),OBJPROP_BACK,1);
 
 }   

You may not get the exact low or high, but you should be really close to one.

The Q’s were made for the 4 hour, yes, but seem to work here just fine.

        if (iFractals(symbol,0,MODE_UPPER,i) && High[i]<iBands(symbol,0,30,2,0,PRICE_MEDIAN,MODE_UPPER,i) && High[i]>iBands(symbol,0,216,2,0,PRICE_MEDIAN,MODE_UPPER,i) && High[i]==iHigh(symbol,0,iHighest(symbol,0,MODE_HIGH,200,i))){
        ObjectCreate("Telecom"+DoubleToStr(i), OBJ_TEXT, 0, Time[i], High[i]+380*Point); 
         ObjectSetText("Telecom"+DoubleToStr(i), "Q", 44, "Impact",  Crimson);
         udir[i]=0;
      }
   
         if (iFractals(symbol,0,MODE_LOWER,i) && Low[i]>iBands(symbol,0,30,2,0,PRICE_MEDIAN,MODE_LOWER,i) && Low[i]<iBands(symbol,0,216,2,0,PRICE_MEDIAN,MODE_LOWER,i) && Low[i]==iLow(symbol,0,iLowest(symbol,0,MODE_LOW,200,i))){
        ObjectCreate("Telecom"+DoubleToStr(i), OBJ_TEXT, 0, Time[i], Low[i]+180*Point); 
         ObjectSetText("Telecom"+DoubleToStr(i), "Q", 44, "Impact",  Crimson);
         udir[i]=1;
      }

There is no exact scienece here, there are not even right conclusions. There are pushes towards a decision that you can live with for it works off of a lot of variables and filters.

MFI Geek

Like I said, geeky stuff.

You must ask the question, which is the prevailing divergence.

Why? Because until the corresponding continuation divergence sets in and lays out, price movement is safe in the given direction.

I had to figure out what can you be holding for from the continuation entry. Yes, I had the auto hedge clicked on below 16 mfi.

The answer, as it turns out, an entire 5-wave structure. 3 pops on the 30 sample BB (aim 5-pips out),

Stable Diffusion – almost confusion

Hitching a Glitch

This was a German ambition. The wanted to come up with lyrics containing English words only. They did not have to make sense.

I suffer from a rumor

I suffer from a new born

I suffer from a tumor ✓

A strange kind of humor

in regards to dilettante stuff like “my inner soul”, well, unless you have multiple ones, this does not make sense. You don’t have brains either.

Terrific picture, but the arm isn’t connected to the body.

3 hands come standard with stable diffusion, random number of fingers and impossible angles.

Camouflage is an ahead of its time prime specimen.

Great music and total nonsense lyrics.

If you figure out what the above means, you’ll get a Kugel with Strudel.

Or mit ohne fleisch – just the way I ordered my lunch in Stuttgart when I was a performer at the Bunte Bühne’s Gegen Gewalt festival.

This call…

…worked like a zentralhoff spielen.

Y.O.U.R.S.

The Bear Question

…is a fair question.

I have made this suggestion before that a Weekly E-59 HL2 (in Violet) is a good place to look for a market type switch, especially after 3 clean closes on the new side. Yes, things can be this simple…

…but not always are this clean. A major break up and an immediate RSI2 embedding without any gap fill attemt would be hard to miss clues. Remember those 3 horizontal lines.

Time forward. Other times the clues may still work, but the start may turn out to be sluggish and frustrating. The first conclusion that I would like to draw based on the next image is that 3 weeks of closes on the other side is merely a confirmation that the previous market has ended – a gear shift to neutral.

The second thing is the proof of the pudding. Yes, there are basically no closes above the line afterwards, but what is more important is that the first pullback’s high does not get violated. Now, pay attention to the RSI2. The one with the vertical line and circle is the closest approach of the overbought (87.5). I would call that the beginning of the bear market – gear shift. Even then, the next week makes a higher high and fails it with an engulf, but that rebound swing high remains untouched. It took 19 weeks after crossing the line to call the new market in this example.

The next example is an early bird special.

Let’s call the first E-59 violation a question mark. With the higher high the next week this could be deemed neutral. Pay attention to the drop that followed and was unable to go oversold (12.5) no matter how it tried. The confirmation of the new market was therefore an overbought reading with 3 closes above the E-59, and the best entry was below the low of candle 3, as close as you could get a fill to the E-59.

The incubation on the next one was 5-6 weeks with the neutral confirmation being in place first.

What about now? Back at the big debate zone again. Market is neutral after the 3 red count.

There was an embedding attempt on the upside that failed on the 4th week. There was 120 pips tagged on for a fake out before the engulfing. My preferred outcome here would be the mirror image to leave question for the next market type hanging for longer.

Talk about gulfing…

Theory of Reversal

Don’t mind me, I need to jot things down to draw some conclusions and overcome anticipation bias somehow.

What truns price?

MFI Divergence, MFI Coninuation Divergence, MFI Taper* *, Big Bow Divergence and Sudden Volatlity Rise Reversal

  • in the direction away from and outside the E9D
    ** outside excessive volatility – price hasn’t just recently popped the Ionosphere

MFI Divergences requrie the presence of a White Line: MFI oversold / overbought Or a crossing over the Stratosphere line.
There are two kinds, the Real and the Early Divergences.

The Red, Real Divergence may have a span of 36-54 pips between the start and the end of the divergence.

Another form of a Real Divergence would have a bow in excess of 2/3 of the way between the OS and OB lines.

(Less than 4 pips drop from the swing low, but look at the depth – 66+ read on the bow up!)

The Magenta, Early Divergence may a span of 20-36 pips between the start and the end of the divergence.
An Early Divergence can be rounded up to a Real divergence upon a re-visit and add on extra leg.

(20 pips between the Magenta legs)

Respect the reversal divergences as they may have a lasting effect.

An MFI Continuation divergence requires the presence of an MFI Divergence prior for the shoulder reference level to beat.

A succesful MFI Taper (purple) is as powerful and overriding as a Real Divergence. It requires price falling short from the E9D.

A Sudden Volatlity Rise Reversal would have a temporary effect unless accompanied by an MFI divergence.
Consider the halfway mark faliure between the Stratosphere and Ionosphere to be a rather potent Volatility Rise Reversal Signal.

This Purple taper was doomed after price popped the Ionosphere line (Red w/ Yellow in it) on the downside. Franly, I should not even have a mark up for this one. Volatility reversal arrows plus Magenta divergence below.

There should be a leg up from where the MFI drops below / exceeds the Magenta Divergences shoulder marked up by the interrupted line in the indicator window.

Setup:

30-minute chart.

MFI 14-sample HL2

Stratosphere: + or – 45 pips from the E-64 HL2

Ionosphere: + or – 87 pips from the E-64 HL2

E9D: E-414 HL2 High & Low

Arrows:

   if (High[i]>stratou[i] && Close[i]<High[i]-(High[i]-Low[i])*.8 && High[i]-Low[i]>100*Point){
          ObjectCreate("Poe"+DoubleToStr(i), OBJ_TEXT, 0, Time[i], (High[i]+Low[i])/2+150*Point); 
            ObjectSetText("Poe"+DoubleToStr(i), CharToStr(222), 32, "WingDings", Crimson);
     } 
      
    
       if (Low[i]<stratod[i]+50*Point && Close[i]>Low[i]+(High[i]-Low[i])*.8 && High[i]-Low[i+1]>90*Point && iStochastic(symbol,0,120,3,3,MODE_SMA,PRICE_MEDIAN,0,i)<15.5 && iStochastic(symbol,0,120,3,3,MODE_SMA,PRICE_MEDIAN,0,i)>4 && Low[i]>stratod2[i]){
          ObjectCreate("Poe"+DoubleToStr(i), OBJ_TEXT, 0, Time[i], (High[i]+Low[i])/2-60*Point); 
            ObjectSetText("Poe"+DoubleToStr(i), CharToStr(221), 32, "WingDings", DarkGreen);
     } 

Megaphone Mega Fan

Short & sweet this’ll be.

The last mega effect went like that:

Gap to nearby the lower end – cover your directional holdings) at once – scale back in inside the structure in the same direction for up to the middle axle.

Ira always says that a higher high and a lower low is not a trend. There would be a spectacular showing very soon. Weekend incoming.

Obviously, the favored direction would be the continuation of the last move.

I would look at the 14-sample 2.0 std dev window envelope to exit the next leg (either a stall at 1.0464-54 – cyan leg up) or at the 3.5 std dev window envelope at 1.0314 (yellow leg up)

Money Blows

— an absolutely no audience special –

First question: has there been an end of wave weekly swing low lately (in 20 weeks) that did not come off of the 14-sample Window Envelope?

(see arrows)

Second question: is a 38.9 stochacstic reading close enough to 40 to be calling a continuation divergence?

If so, then the C leg merely started a few days back. The Energy curve is printing the first hump, that preceeds the Push and the Echo. I have no name for it yet, but measuring leg was used before, so maybe measuring hump. Both the Push and the Echo would have to arrive with incrementally higher energy hunches, the Push – as mentioned prior – would print a Stab (a quick, linear move appearing as an energy plummet – red verticals) and the Echo would arrive even later with the Desperato / desperate reach (usually a lower low / higher high – green vertical) before this whole ABC structure would come to an end.

Now, Money Flow affairs.

After the Euro peak was mode, the first money flow rebound I marked up in white. I did not quite know what to do with it at the time. I did notice that when money flow had exceeded this reading, that was a perfect continuation entry (red block).

Here we are again with the white bag above my door, money flow rapidly approaching the continuation level. Stochastic is embedded oversold. Notice that the swing high and the money flow high did not coincide, and a lower high could easily show a more overbought level.

37% of the people are net short. I am one of them.

Question #3: have we seen the low?

The red arrows? A recent idea.

    if (High[i]>stratou[i] && Close[i]<High[i]-(High[i]-Low[i])*.8 && High[i]-Low[i]>90*Point){
          ObjectCreate("Poe"+DoubleToStr(i), OBJ_TEXT, 0, Time[i], (High[i]+Low[i])/2+150*Point); 
            ObjectSetText("Poe"+DoubleToStr(i), CharToStr(222), 32, "WingDings", Crimson);
     } 
      
    
       if (Low[i]<stratod[i]+50*Point && Close[i]>Low[i]+(High[i]-Low[i])*.8 && High[i]-Low[i+1]>140*Point && iStochastic(symbol,0,120,3,3,MODE_SMA,PRICE_MEDIAN,0,i)<15.5 && iStochastic(symbol,0,120,3,3,MODE_SMA,PRICE_MEDIAN,0,i)>4 && Low[i]>stratod2[i]){
          ObjectCreate("Poe"+DoubleToStr(i), OBJ_TEXT, 0, Time[i], (High[i]+Low[i])/2-60*Point); 
            ObjectSetText("Poe"+DoubleToStr(i), CharToStr(221), 32, "WingDings", DarkGreen);
     } 

End Of The World

Should have said end of the blog.

Now that my turout has dropped to 5 views per post, I am determined to finish the destruction, and get it down to one single view.

Oh, I have the master plan for this one.

If options have Greeks, trading has Germans.

A quick word about Walls, Berlin or not.

3 walls in one direction, 2 in the other, which is the way of progression?

The white line in the Stratosphere. The 45-pip (fluctuation maximum) displacement of the E-32 as per Hourly.

The first reach outside for a big grab of nothing is the Luft.

The second, as the old German wisdom holds it, is the Luftwaffe, as where there is Luft, the Luftwaffe wouldn’t be far.

The third one is Concorde as to commemorate the British and the French.

You see, I always thought that if there would be only 2 men left on the planet, one would be German and the other one would be Japanese. You would need to truly believe in your superiority to give you the extra edge. No, being “God’s chosen people” would lot qualify, this is not upto voting.

So I started my own Eurasian Race. She goes by Zulfen Tralfen Zulfie as her German name and Zuflasyei Shusmichiro by the Japanese. With this sneaky twist she can infiltrate these people by their flank, and it is going to be a whole lot easier for her to assimilate. What’s more she would get to pick between the two guys standing. 50% chance of succeeding every time.

(The World’s Laziest Sex Tourist)

Ok, let’s proceed from where I left off last time.

We have a valid opening move to the downside, yet every move comes to an end.

A Push contains the Stab (or Stahl) and the Echo episode contains the Desperato (Deperate effort to live up to the once great nation).

Once this sequence has sailed (on a U-Boat), the Daily chart would print either a continuation divergence or a counter P-E sequence resulting in a sideways / corrective pattern.

If you look back on the history prior, you will find that for a continuation you would either need the the 18-sample stochastic to print an 88+ reading or the E-50 ribbon would be above the 2.5 std Deviation BB top, whic would cap the move. The latter does not happen often at all, certainly not likely at the beginning of a move, see the Teal ovals below.

The point is that I think you should be looking for an 80+ stochastic print, since the upper BB would not dip below the E-50 ribbon for at least a few weeks.

Whoever controls the heartland controls the world. The US blew up the gas pipe to sabotage the birth of a counterweight.

Fractal Synergy

I started out my trading journey in the field of Fractal Energies.

I guess you can say now that I am back to my fruits.

Too many Ys in this one.

Every route ended up leading to the same path.

Measuring leg & divergent leg / zero & mastodon / push & echo were of the same coin all along.

The conclusion had to be the same too. The market has to get in a higher state of charge before holding enough energy to make a change (for once in my life), step on the man in the mirror and be able to feel real good about it.

This divergence can only be measured between two well chosen reference points.

Echo thus is set at a point in space time where the inability can finally be overcome by ability.

Price/Earnings = LED Ceppelin

CiP < CiE

Why 12 sample? Because it is 7 + 5 and also 48 /4.

All I need now is somebody with some money.

If I can’t help you, I won’t help nobody, baby.

ECB Planetary Policy later today.