When Kennedy said, “we choose to go to the moon and do the other thing…”
The other thing was obviously figuring out trading.
They could not let that happen.
I’m that type of guy who finds all answers.
Check if I pointed out the principle that to put up a fight with an attack from one side, you need a commander that ranks one lower in my Canon Folder blog entry.
What can counter a Zero? An “M”.
What can counter an “M” (Resident Evil)? Something that ranks just below it, i.e. Vice Resident.
The importance of ranks was there and my other blog entry, Near Hisses talks about near misses of the M-axis or the Zero-Mastodon trendline. There was even a YouTube video introducing it – I was conscientious of its importance.
All in all, the 3-point turns are the strongest.
An attempt on a fresh M-axis ranks just one below the strongest turning trifecta: a near miss of the M-axis.
Neil, my arms are strong
As my Sketchers – the type that would be too small for most of mankind – touch the sand, I feel the overwhelming sensation that no man has gotten this far before me.
How could you possibly trade effectively when you don’t even know what this stage of the market is about?
Lucky for you, I might be able to help.
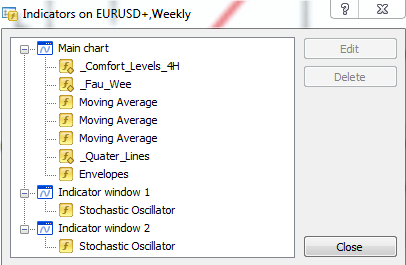
The starting kit was passed down to us by our Godfather, Ira Epstein.
During embedding, the market locks in a trend.
So far so good.
A stochastic reading below 30 is oversold, above 70 is overbought. Digestible.
Here comes a deviation. I do not have to wager client base and 40+ years of reputation if I did not get some values right off the bat.
This is why I found my 18 sample, not smoothed stochastics better along with changing the embedding limits to 25 and 75. I do not believe in using the same settings on indicators on any time frame. What is the point of plotting a 200MA on a weekly chart?
On to additional personal takes.
During embedding the directional progression (new lower low/new higher high) comes with a guarantee. Yet, the volatility falls short of spectacular. It is a secure, but not necessarily fast market for making gains.
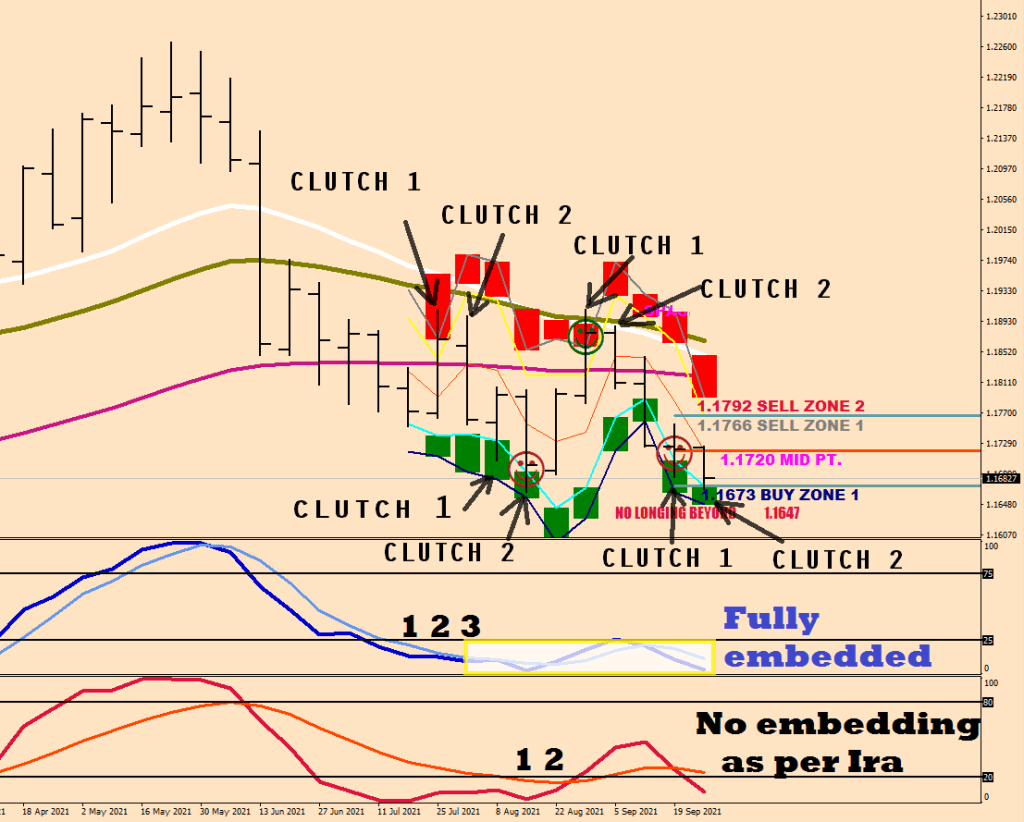
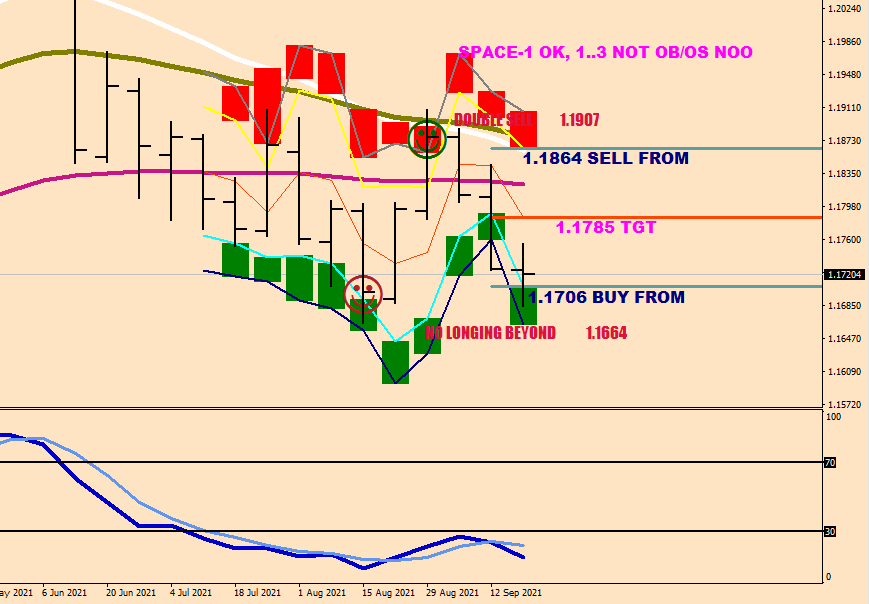
The next image is to show you my theory of the slipping clutch. Observe:
You may not need to cover on the first green box encounter as you can see above, there was a box that got completely sliced through. What you could do instead is wait for a price penetrate a box, knowing that there would be a second box encounter further down the road, you could add to your short during embedding.
Double clutching is necessary to shift the gear stick from forward to backward. And visible reference comes from 2 different candles = 2 different weeks in our case. Back to back trading days could only qualify in a Friday & Monday combination.
Ira’s stochastics show embedding by his definition for a couple of weeks during this whole time. Mine shows the double clutching issue persisting all along.
Combine this knowledge with the buy and sell zone locations cited in the previous entry, and you would start to develop a very good sense of direction.
After the price fails in the double sell zone on the way to the E-21, you sell until they buy it back in the green fields two times: you only die twice.
Then it is a long trade into the red field, and if the E-21 gets surpassed by 40 pips or the embedding gets lost, you can ride some more.
There are profound hedging implications of course due to the persisting predictability.
As for other Ira definitions like re-embedding and both the K and the D lines must be over / below – may just be obsolete with the better settings. D line (signal) would be enough to monitor.
What about this market? I’d say the market will have changed to a full bear configuration once the Weekly E-34 crossed below the E-59, but that won’t happen this week. Until then this is a mixed market with the bears luck lasting till the 21EMA and the embedding holds.
You’ll find the displacement percentages in the prior post.
…
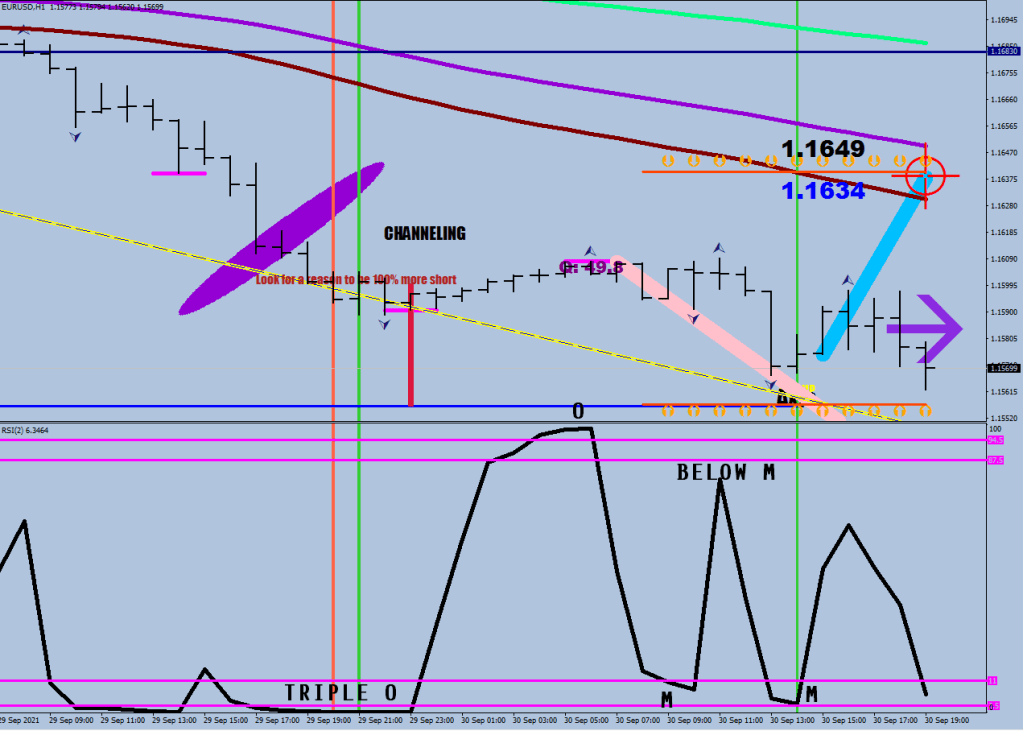
This midnight magnet (acceleration vector) just got its filled
You are still in buy zone 1 – pay attention to the NO LONGING BEYOND 1.1647 on the first image.
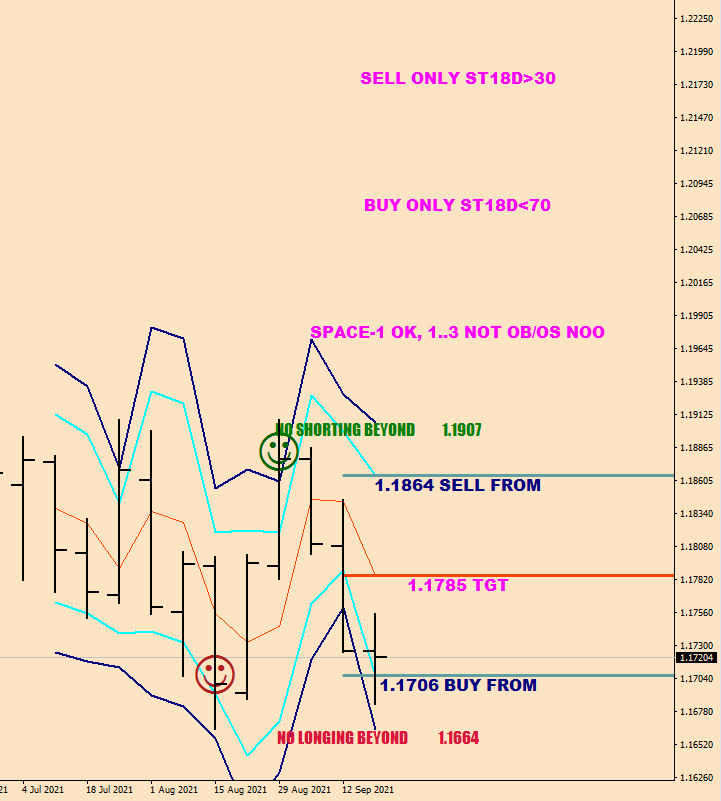
The area between the E-34 and the E-59 is a good trend following entry with the configuartion being stacked right.
Target the Window Envelope.
But two closes on the wrong side of the E-59 may be the start of a total directional change… after embedding and the total re-configuration of the EMAs – that is.
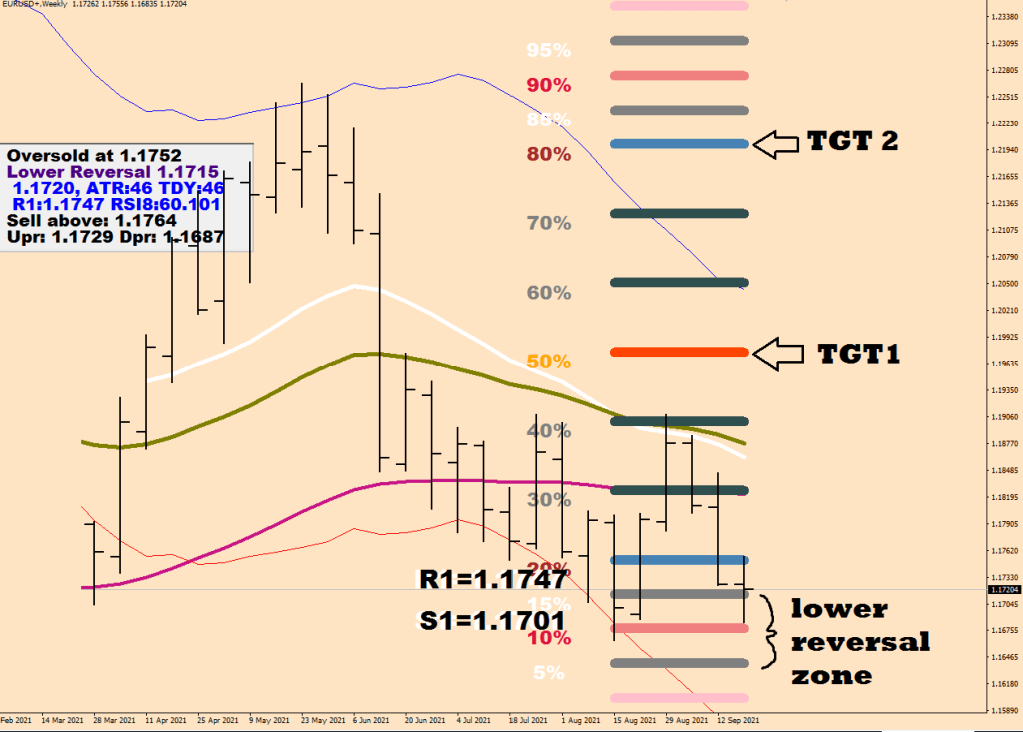
What does sell only ST18D>30 is that you don’t want to be selling an oversold market. 18D is the delayed/smoothed 18-sample base stochastic line. In fact, the only good weekly short entries have been outside the +50% range (not promoted) that got no follow through the next week – they worked only because the 21 EMA along with the Embedded oversold condition was backing them up.
Is this a seller’s market?
The configuration of the EMAs has been bullish until 2 weeks ago when the 21 crossed below the 34.
Within the window envelope and the 21 EMA the risk reward currently is almost neutral, close to 1:1 – bands & EMA will be sliding flat to lower presumably.
Losing the oversold status (20% in blue at Comfort Levels) would open up the possibility for a run to the 50% marker and possibly the other end of the range as well.
The lower reversal zone is the 15%-5% range.
On the way up, difficulties may arise around all 3 EMAs & two weekly trendlines. Fau Wee is providing the RSI lines in this case, the limit line was hand drawn.
Further stumbling blocks would be the relevant 4-hour fractals and the volatility caps that would shape the wave structure.
The inverse head and shoulders that was printed on Friday isn’t visible from this birds eye view,
but the 65 pips addition to the neckline would put price next to the upper overdrive band.
Sauerkr out.
After some thinking I changed the NO SHORTING BEYOND to DOUBLE SELL whilst the Embedding condition is on and the E-21 isn’t violated badly. I also preferred my 18-sample stoch K above Ira Epstein’s 12-sample Close stoch K & D smoothed. I don’t ever seem to go with the factory settings.
Railroad tracks are an alternating positive-negative candle sequence with closes and opens forming two horizontal lines and have meaningful body sizes.
It is best to have candles on to be able to spot this event.
What usually triggers this condition is low energy reserves and time pressure to consolidate all strength under the shortest time possible.
Minimal pullback before the ultimate target.
The railroad tracks lay down an artificially high base line keeping the volatility level elevated.
The price will break from this pattern in the wrong direction first trapping the break-out early birds.
There was this RRT on the hourly, so I thought I would pass this on.
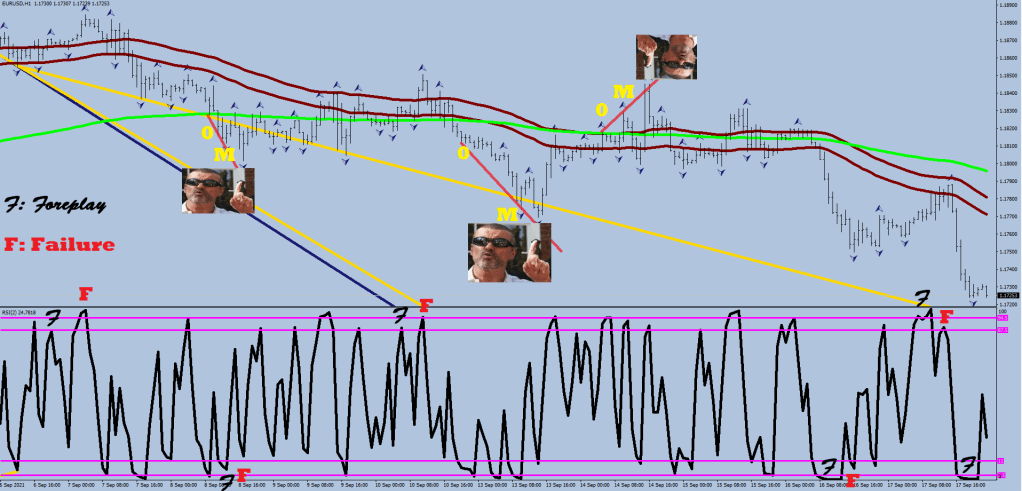
i became a British citizen in 2019, but I have not started exercising my rights for inventing stupid slogans until last week, when I came up with this: there is no failure without foreplay.
No, I did not mean the day before you came.
I realize that the world is tuned onto sex and is full of misunderstandings.
I of course get up, stand up and don’t give up the fight for the ultimate understanding of market mechanics, what makes it flick.
i present you my evidence one failure at a time.
Some vertical lines to catch your interest.
Let’s pin your knuckle to the pinnacle with this one:
Define foreplay – it goes 3/4 of the way.
Failure – typically reaching climax short of the second goal line – a higher high / lower low.
To throw a monkey wrench into the Apple emblem, a zero-mastodon sequence does fit the foreplay & failure coupling, yet there may be yet another attempt to come to the zero-mastodon axis for George Michael / One More Try, so respect them mastodons accordingly. (A mastodon-fetish is completely normal, it is a mere attraction to overtly hairy things).
The implications are severe, the complications are uncanny. The whole idea is to restrain premature capitulation.
So that we are on the same page, I missed out on 8k gains on Thursday and Friday by calling into question the validity of these findings.
There is a also a way to turning a success to a failure, so you should know about this.
When you watch a lot of YouTube, you may start to think that all charts secretly have an Australian accent, and that the authentic name for a gravestone doji was always pin bar from the beginning of time.
What is the main point of giving names to RSI2 legs?
To know what kind of opposition would be able to reverse price.
See, there are ranks. There is hierarchy, there is supremacy.
Let’s see a basic case. From a zero turning point price shall commute until it gets tired and faces enough opposition.
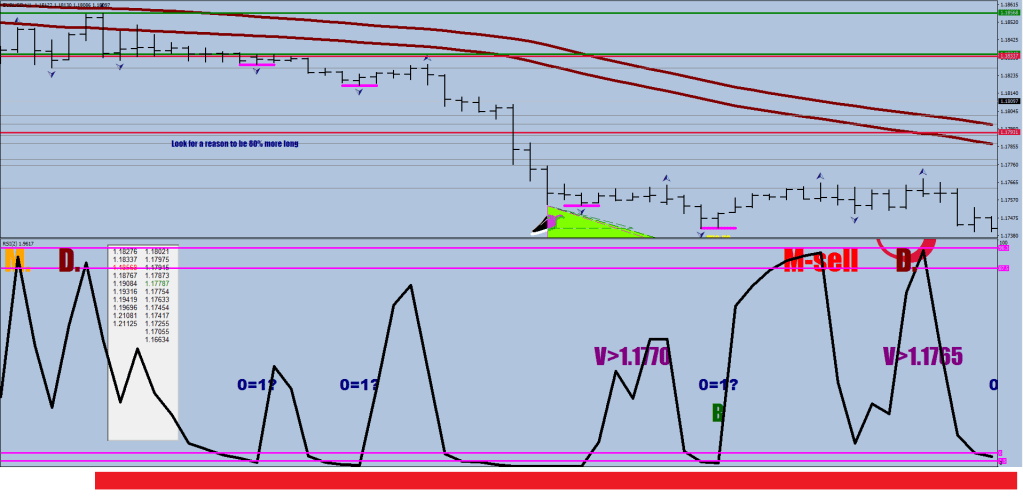
The point I’m trying to make here is that the Zero ranks high in the hierarchy, from the single Zero print the price is going to be commuting in the opposite direction and it won’t turn back until at a minimum an M + D prints.
Therefore at the time of the Zero print you can already know that you would need to see two distinguishable legs that can kick off a counter move.
On the example above another M + D turned the direction back down, but once the M printed you could had put out your pending orders 1, 5 and 10 pips beyond the peak of the M knowing that this is going to continue lower. 1 pips beyond half size, 5 pips beyond the full size, 10 pips beyond going into excess. Notice that the D print may be scoring in the M field itself, but it is still called a D (divergent leg) for the proximity in time behind the M leg (in the next 6 hours or so).
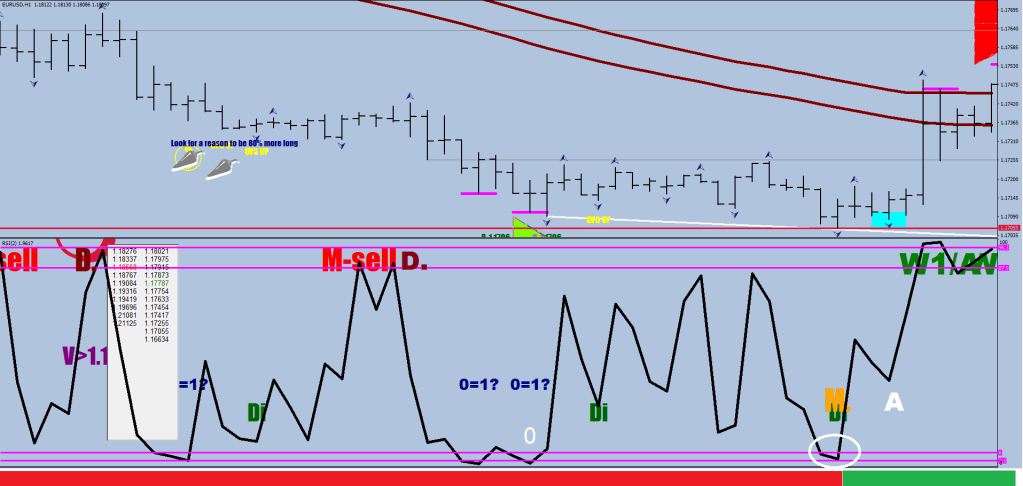
On the image below the Zeros do not turn the direction back up, because the previous turning sequence did not rank higher. (M+D < 0)
There was an M+D continuation entry. Where D did only exceeded the M by 2.5 pips, so your sell order would only get filled for 1/2 size at the 1-pip beat.
The Zero sequence was interrupted again only with a brief M+D with the same 2.5 pips beat and half order fill, and the zero sequence kept on going until an M was printed. A Zero – M sequence draws a Zero-Mastodon axis.
At the Mastodon print the price direction officially is changed back up: 0+M> 0, and you know that a beat or a beat attempt may follow. In this case you got a 0+M+A reversal.
Two Zeros followed, that turned the direction back down. The 0+0 just as an M+D sequence was about the displacement, which was just shy of 5 pips -> 1/2 size sell order at 1-pip out.
The Double Zero was ranking just below the 0+M+A, so it did manage to reverse the direction back down, but Wave 2 down was short lived: a Zero Print followed (and even an M a little later), which, ranking just below the Double Zero changed the direction back up.
A score beyond the first magenta line is considered a soft reset that can temporarily yield to a counter move, which would normally mean a sequence of a measuring leg + a divergent leg. (M+D).
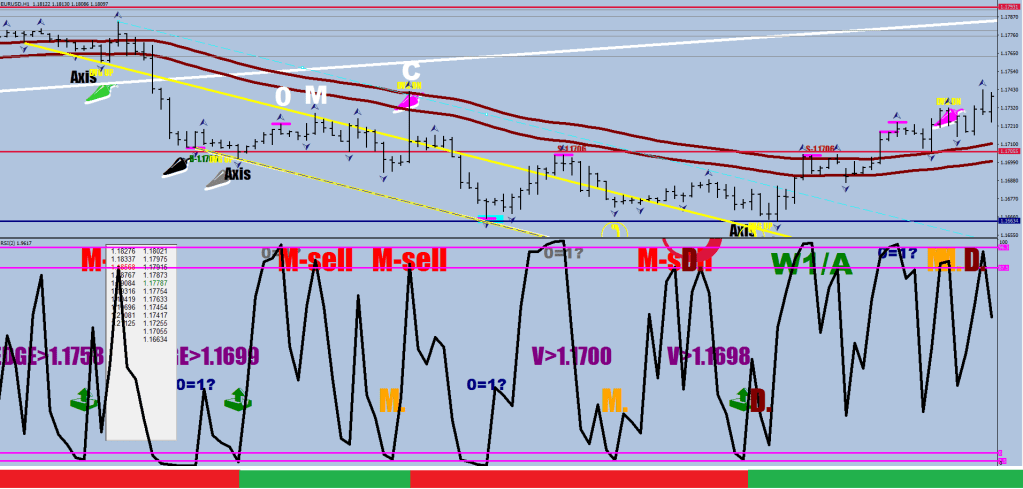
The next reversal down was a rather tricky one.
First of all, the expectation of seeing a Wave 3 and not a Wave C throws the perception off. If you think about it logically, a Zero is one step down from a Zero + M. There was also a double top kiss goodbye / beat Attempt setting up a lower high, and the structure was on its way down to print a Wave 1. From here on the plots and the perspective get distorted. Wave 1 did not end until the Mastodon print. Wave 2 ended on an “M”-reset. Which was in fact an M+D sequence but the dip between the M and the D leg actually went lower than the ending point of Wave 1.
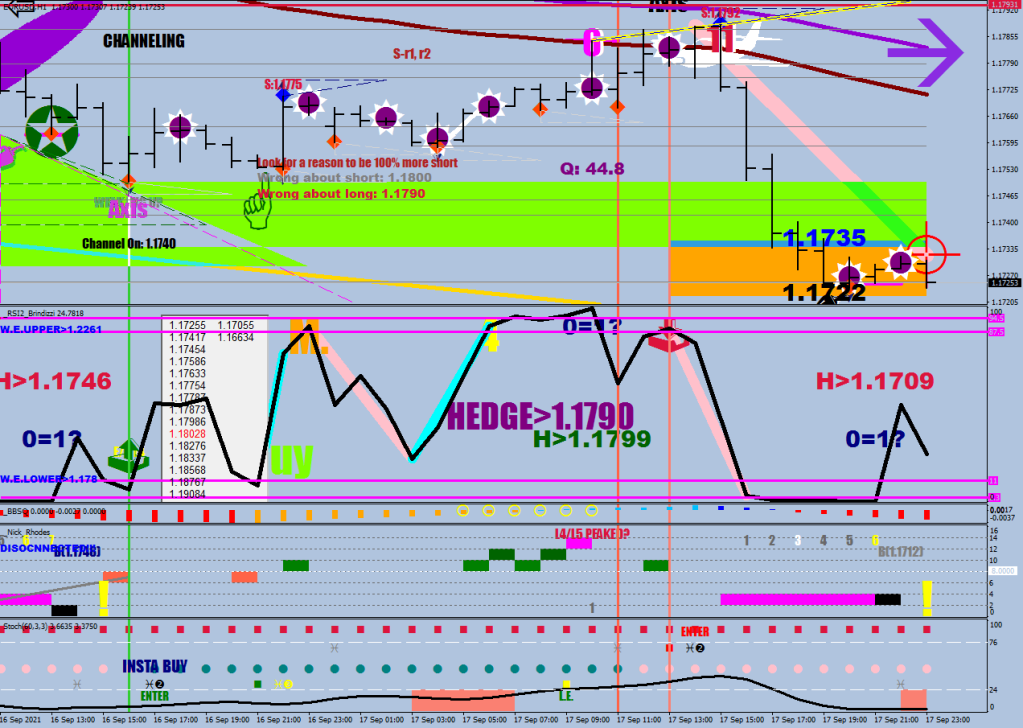
So to be prepared for break outs, it is time to discuss what you should have a pending order out for: a Zero print exceeded in the direction of risk by 15 pips is a good place it at. The white line is the approximate location where price went beyond the Zero by 15 pips. When a break out is in progress the market is likely going to start channeling.
A lot going on here, the barely visible Turquoise channel line is a parallel of the Zero-Mastodon Axis projected from the swing high of Wave 2. After the break out, the Zero-Mastodon print temporarily turns the direction back up, and the opposition of a Zero-M gets rounded out to be a full Correction, or a Zero-M-C, where C lands on the parallel channel line and would get you in trouble if you had a pending order 15 pips beyond the zero that falls on the wrong side of the E-67 channel. Don’t do that. After the 0-M-C sequence, on the downside there is another 0 print, the Mastodon itself (extraction mark) is at first higher than the Zero, but it finally makes it back below the Zero in an M+D fashion, and the 0-M is one rank below the 0-M-C, so the reversal gets made.
I know, this is now starting to stretch too long, so down to current sequence conditions.
What can oppose a Zero-M? One rank down – I’d say, a Zero.
And what could oppose that Zero? An “M” in an M-D fashion. Either that, or a Zero that falls short of the E-67’s lower band and has a swing length at less than 32 pips would be continuation entry down.
I jot down ideas in a note-file for raw materials for new writings.
I wrote poisoned magnet somewhere, but could never add anything to it. This is what happens when you are a poet: you fall in love with mental image like that.
Anyways, back to the lesson.
A mean reversion turned into something else
We can agree that the mean reversion only called for 1.18017.
If an RSI2 magenta interrupted is a soft reset and a zero that gets printed put of an E67 band crossing with enough directional volatility is a hard reset, then the return to the Green River resets the whole power grid. A new direction can be picked without reprehension.
What is the story with the 17+ pips penetration beyond the Firestarter line?
I have a theory about corrective waves, or at least the M.O. of a C wave.
A Wave 1 (impulsive) usually falls short of the 3-day ATR by 20 pips – I call this the sound barrier.
A Wave 3 (impulsive) usually ends in the 3-day ATR to 3-day ATR+30% zone, and if it exceeds it somewhat, the day typically would settle back in this zone.
A Wave C (impulsive) has all 3 legs: Measuring Leg, Divergent Leg and Beat and usually falls between the sound barrier and the 3-day ATR halfway (or 10 pips shy of the 3-day ATR)
I’m not a trend vector expert yet, but I opened up this field by identifying the two sub groups & starting to explore their features.
My biggest lessons in trading seem yo be rather homogeneous: all you had to do was do nothing.
Therefore I have come to ask myself a lot: what has changed?
See, there’s a lot at snake here. Yesterday I had more shorts than longs. Then I dumped all shorts for chump change. If I were conscious about the touch/crossing over the vector line, I could had spared myself a 3k draw down and by taking on longs only on the other side both directions could had contributed to the bottom line.
I have yet to figure out things like: does time have on effect on the strength of a newly printed line? Does the presence of the mean / lack of trading throw things off? Is the Midnight Brain (acceleration) the main thing to pay attention to? I’d have to name things accordingly when I’d be a little bit firesmarter.
Very good movie this was.
She looks like a ladybug & acts like a punk – hmm. Mr. Blomqvist certainly has aspirations.
Open your mind. You are used to being shocked on this blog already. Take a deep breath.
What is a trendline?
A trendline is an indicator that represents the trajectory / vector of a motion at its extreme.
There are accelerating and decelerating vectors in combination with the underlying strength measured by RSI2.
Your expectation of the next attack on an accelerating vector to be touching / going beyond the vector and the expectation for a decelerating vector is that price is going to fall shy from it upon the next approach.
Implications: next time you see somebody drawing a line without making an attempt for determining if the vector is an accelerating or decelerating one, you get to roll your eyes.
Next time you hear somebody saying, that they don’t like / use any indicators, but heftily start engaging in drawing lines everywhere, you get to judge them for their absence of understanding.
Next time somebody tells you about their course on the 3 different kind of trendlines, you get to tell them: “F* Off!”
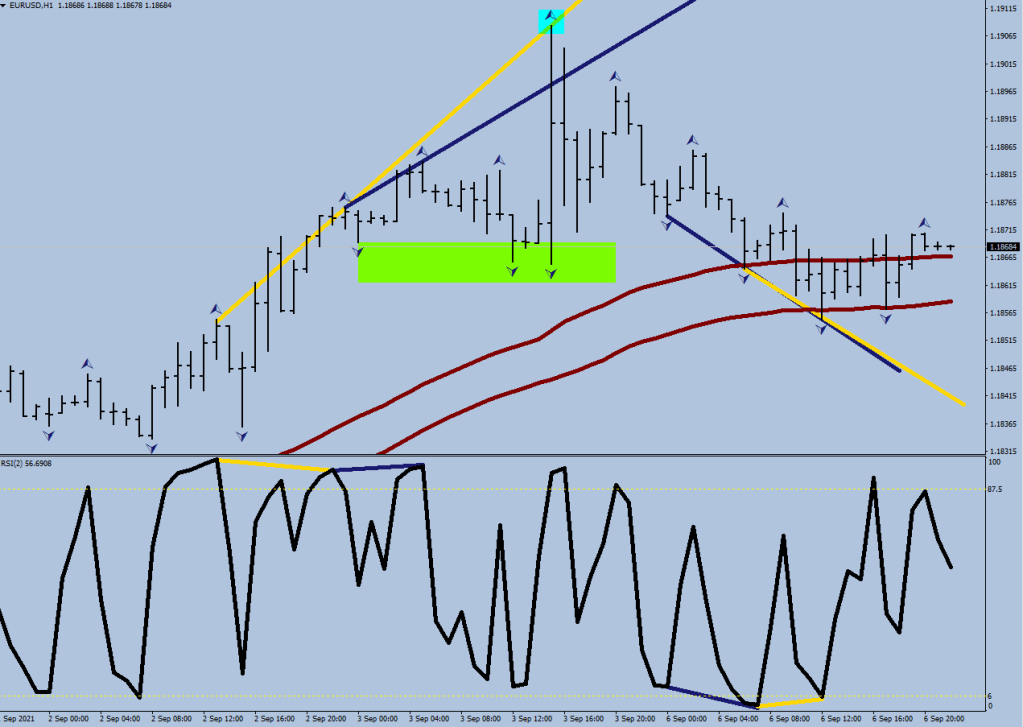
First, an hourly image to show the two colors.
Gold is a decelerating vector – if you don’t expect it to be touched again, yet price does just that, what do you do?
Midnight blue – it warns you abut the accelerating in buying / selling. It is a hint, that this vector is going to be exceeded with high likelihood, therefore you can keep adding to your position, the further you are from this axis, the better would be your reward.
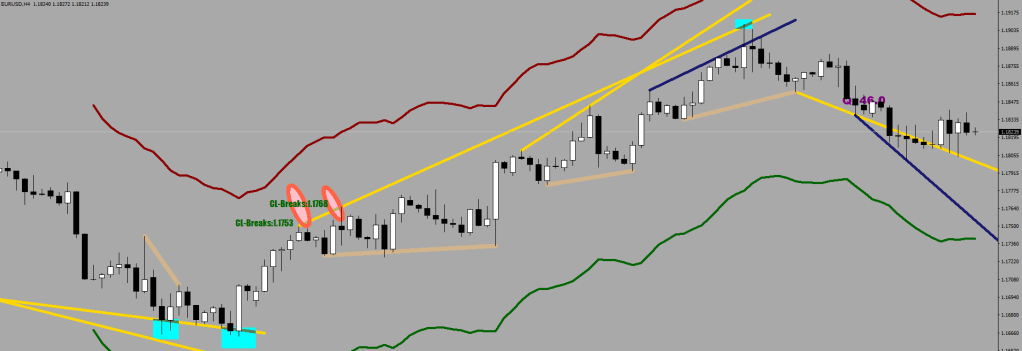
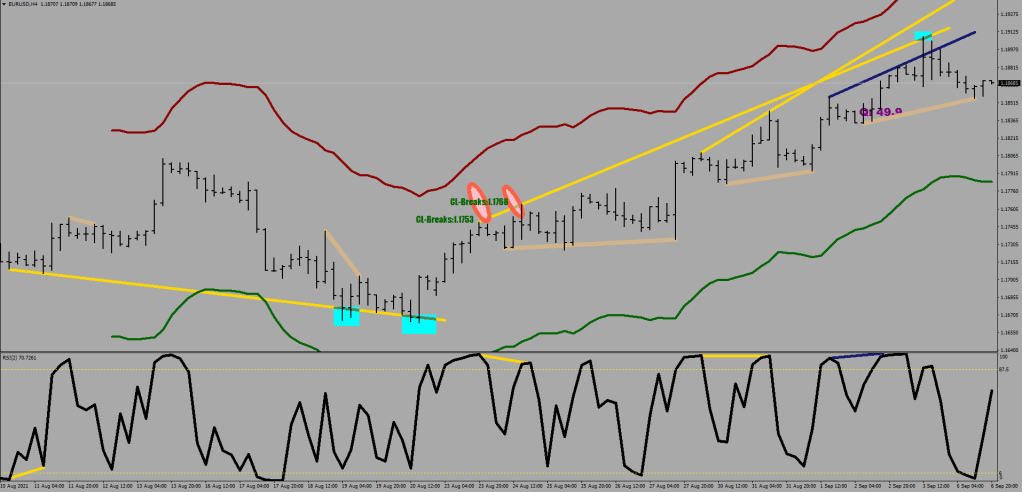
& the 4-hour for good measure.
(the Khaki lines are continuation divergences – auto plots of the Overdrive 240 routine)
…sharing this article to help you avoid the mistakes I have made…
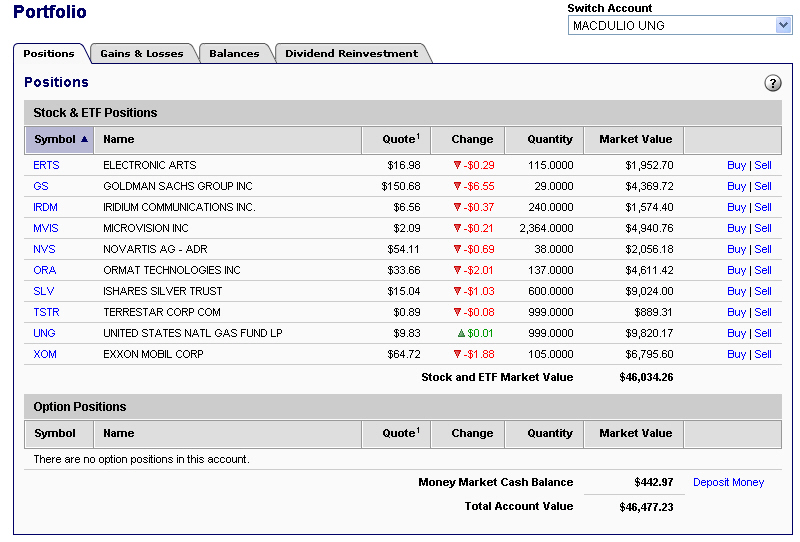
Unless you are the Gugenheim Foundation and managing 294 Billion Dollars, you do not need a portfolio. With the large numbers your objectives would become very different as well. You are not eyeing major capital gains, what you are trying to do is storing wealth into the future with hopefully minimal losses. Pension funds and the retail are the default suckers to dump unwanted stocks to. A portfolio would multiply the possible ways of accumulating losses and would heavily cap your gains potential.
Stocks make zero sense to me: for the few that pay dividends, you would have to have held them a year back, and say one dishes out 8% which is the very steep end of the spectrum, but the stock itself is down 10% from where you bought it at, what did you gain at all? Wash sale rule makes it futile to sell within 3 months, for you do not get to have the benefit to write off losses, yet you have to pay capital gains on all of your wash sales (I had to pay capital gains on 32k despite of my portfolio being down 35k in my first year; by now even unreported crypto gains may set you up for tax evasion). Stocks come with all kinds of risks from merger, earning reports, medicine trials, mismanagement. I only owned like 10 different stock in my entire life, and 3 of those ended up in court papers because of mismanaging inverstor money (Apollo Group, Ormat, can’t remember the 3rd, was it SmithTown Bank?). I ended up opting for Mark to Market, but that still did not answer all the headaches that come with owning stocks.
There is another way to buy into a company’s growth. Look up what Chamath has to say about Tesla and corporate bonds. They come with 0% downside risk if the stock drops and 90% participation in the upside. He was the guy calling Amazon’s 25-year 25% a “drop mic.”
Here’s Buffett’s average yearly return for comparison:
For further gain percentages comparison, Jim Rogers & Gerorge Soros’s Quantum Fund – so goes the legend – had returned 4,200% gains in 10 years. That’s not 420% per year, it was calculated with 45% compounded gains yearly (although that figures to be 4,108% I believe). Some people have no living expenses or taxes to pay!
My education was very expensive: $250k and the opportunity cost of a whole decade. Most of my losses were due to Weekly Options expiring worthless and triple leveraged, index based ETFs, which had daily maintenance cost plus back then every trade ran me $7.50-$8 . (ThinkOrSwim was a little less than ING).
See, Go West & Invest did not pan out for me. My whole investment portfolio reached a temporary peak of +15%, when I went to DisneyLand just to return for a major gap down (with triple leverage) kicking in a cascade of having to fill in margin / averaging down until 6 months later down the road missing out on the end of the bear market’s bottom and holding virtually no positions for the run up. I was losing an additional 20-30% with every gap down for 3 weeks straight, which led me to eventually make the stupidest steps of my life: betting naked weekly calls 20k at a time & wiping them all out at the end for expiring out of the money (3 times of that as well).
The biggest misconception for those who can even distinguish between a stock and a currency, is that they think that everything that has data that can be turned into a candle chart can be traded the same way. Obviously an option can be charted but it does not trade the same way as the underlying stock. Not as obvious are the differences between stocks, ETFs, futures, commodities, currencies.
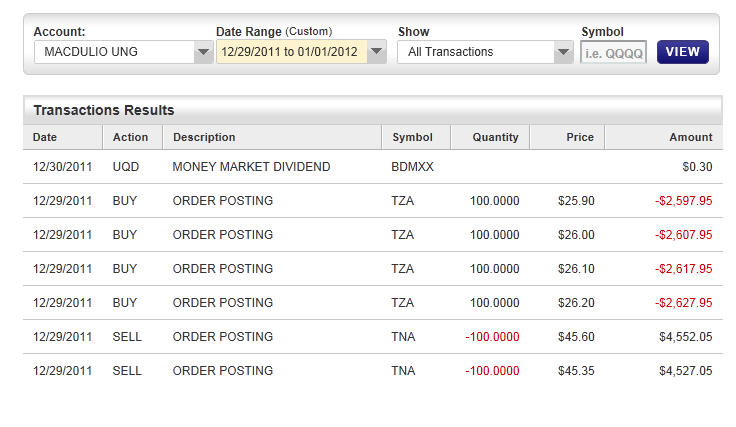
I used to trade UNG for a while. It was a pure windmill fight on the long side due to the underlying contango which I was not conscious about at the time, yet I had come to learn the way to survival by knowing when the weekly natural gas stocks report came out (I think it was 10 AM PST) and dumped on up moves my averaged down long entries.
But you obviously want more than survive.
I remember when a social media user was bragging about batting 16% with his portfolio in one year. He clearly had holdings at the moment he posted this, so he had multiple risk factors that could had re-adjusted the bottom line even the next day. Compare his temporary number with my yearly gains and the fact that I am all cashed out most of the time.
Not that Forex is much too easy. I do not know a single person who has been successful on a multiple-year time frame, and I am no exception.
I’m not sure how self proclaimed trading educators came up with the volatility difference between equities and Forex is 20% less for the latter, when you can see that a 1% move in USD translates to 5% on the S&P.
Yet I have worked out a way that lends me the hope of catching up with the losses and excel into the future. There is a good chance that I can claim back all of my Forex losses in the coming year.
To succeed in Forex, I had to find and exploit all possible edges. Starting from the lowest cost, the highest leverage, best liquidity (only one currency pair qualified); getting the size right, to building the right tools & indicators.
Finding the right broker without knowing what is out there and what parameters to look for wasn’t smooth sailing either. FXCM with their split window system was confusing and without MQL4 I could not possibly have developed the right tools. With Easy Forex I learnt about how important the spread size was having a “fixed spread” account. It was not actually fixed, but more like minimum 3 pips on EUR/USD, minimum 8 pips on GBP/USD that I used to trade a lot and 14 pips on an exotic pair like AUD/NZD. Imagine being at 14 pips loss the moment you open a trade!
Squared Financial taught me about the importance of being able to deposit without delay onto my account. I had to make phone calls to the market maker (here meaning spread-adjuster) sitting in to beg them to credit my funds over the phone. I got to learn their names & personalities! Later they passed me down to a sister company due to ESMA and forgot to mention that my 300:1 leverage was gone forever and now trade with the Cyprus forex company with 30:1. The worst of all worlds.
I never had a real account with IC Markets, but since I was testing all of my auto trading routines on their demos, I have come to learn intimately a painful feature of daily transaction cap: they would suspend your account if you exceed 25k transactions – which may sound like a lot, but for instance a trail stop or a frequent delete / place pending order loop can surpass this kind of a limitation in 15 minutes.
LQDFX had a lot size limitation of 50 (compare it with 1000 at Squared Financial) and bad liquidity.
Brokers may take money away from you, but what they cannot take away is your intelligence with which you can innovate and find your way to making profits in this world full of scams.
I used to hand out my Broker Auditor routine in the software package that came with my e-book, the Computer Aided Trading.
People who are satisfied with their broker’s 2 or 3 pips spread should pay attention to the average trade pips of my statement. I pay less than a pip round trip for commission and spread. Even if I only made 10 cents on a trade, one million times that is a 100k -this can buy you a property or at least a half in most countries (I paid for my 3-bedroom house in the Philippines a little over 30k USD with the upgrades).
Cheer up, you have not yet hit rock bottom if you did not end up having to work as a night kitchen porter at the Pullman Hotel.
What you should under no circumstances lose is your integrity.
There must have been people who were able to make 10x gains in a year, but they certainly weren’t the YouTube high fliers selling you their crap.
Despising scammers, staying away from them and their ways is in your best interest, and I am begging you to avoid at all cost fake gurus such as Samuel Leach, Stephen Dux and Tim Sykes – they would only ever be able to show forged proofs i.e. on Profitly – which is owned by Mr. Sykes or via owning a Forex broker that gives a leverage to forge account statements – and this guy even ventured into an ICO of his own. Ask yourself the question now, why is anyone issuing an ICO at all? To me it sounds like the need of doing this comes with a certain kind of personality.
Don’t bother with binary options either. I personally never fell for CFD trading or Crypto, but had my schooling in most other. Do not fall for automated trading routines either, if you do not have the same data provided by the same broker and the same privileges, your results would be wildly different.
Sure, I have things for sale here. I would be an idiot for giving away everything for free, for I have expenses such as the blog or the maintenance fees of the USD account, but I don’t over promise and under deliver and certainly have personal problems with injustice.
I sold 2 electronic books with my added software package for $25 each and gave access to 2 people to all of my routines and their updates for $52 and $56. So don’t compare me with scammers ripping you off for thousands for worthless junk.
See for yourself how different it is what I say on how things operate and what pours at you from wishful thinking self-claimed “educators” – which seems to be a never ending cascade of drawing lines, triangles, percentages and comparing things that should be traded on their own merits >
The Sweetest Perfection (This last one is about mean reversion – there is no quality info on the subject anywhere.)
As for my trading, I get biassed by the media as anybody else, and filling up margin is part of the things I have to engage in at times. Although I seem to know all the answers – see the 4 links above – I do not know them by heart. That tiny transition would take me from being the worst trader who can make 1000% gains in a year to an absolute phenomenon. In the meantime I’ll remain Macdulio, the professor of trading.
As for the intelligence mentioned, I can honestly say that I have managed to find the answers for all major questions without using anything that anybody was ever teaching / broadcasting. Did you pay attention to how many times did I mention trendlines and Fibonaccis? Automatization can hold against a bad bias. Defying all odds, I found the right hedging conditions, the most of the proper exits and many of the best entries. Try to do what I did with merely having data flowing from a broker: figure out how the trading of a given instrument works.
“You don’t want to come across someone with a 100% win rate” – a sentence from a YouTube Forex trader arbitrarily drawing 1:3 ratio brackets based on virtually nothing. I don’t want to know you either. Or perhaps he wasn’t talking about me, I’m only averaging between 99.3% and 99.8% in most months. For you the 3:1 is risk management, for me it is a loss-application. I guess I do resemble Warren Buffett since this thinking was attributed to him: “Rule Number One: Never Lose Money. Rule Number Two: Never Forget Rule Number One.”
So, referring back to the beginning: Do you need to make a court case before putting on a trade? Does it matter if the ECB president does not like vanilla cupcakes? Why waste your time with the whys?